COTW: Seasonal Strength?
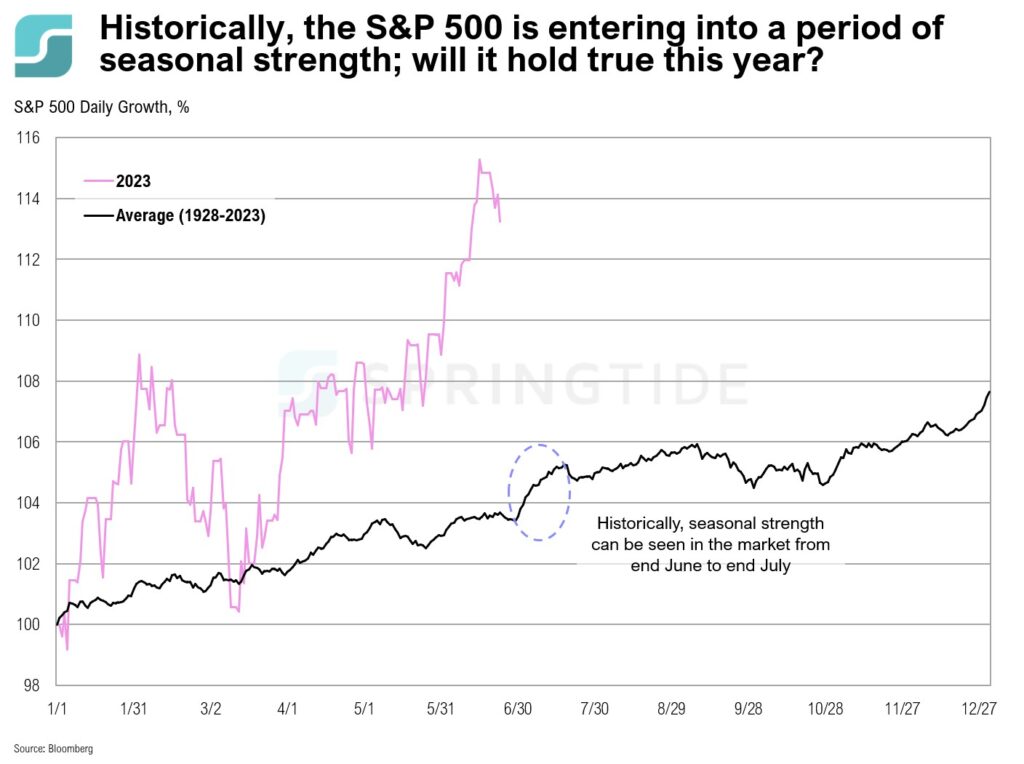
The first half of this year has been anything but ordinary—characterized by a banking sector in March, a widespread acceleration in AI adoption and interest in May, and the recent rally of the S&P 500 into a bull market. When looking at historical returns since 1928, the S&P 500 could be entering into a period of seasonal strength over the next couple of months.
May 2023 Commentary: Bulls, Bears, and Bots
In late May, an agreement was made to suspend the debt ceiling until January 1, 2025. As part of the agreement, student loan payments will resume within the coming months, barring a Supreme Court ruling in favor of Biden’s forgiveness plan.
COTW: Ongoing Banking Stresses
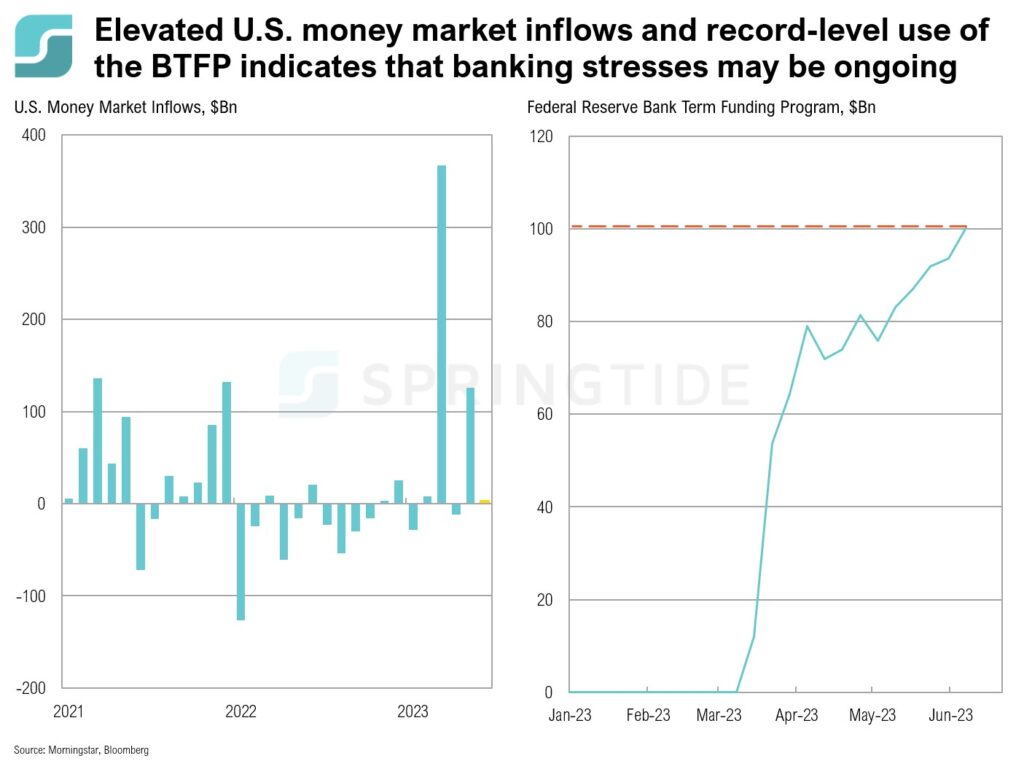
BTFP usage skyrocketed in March, reaching a peak in April. Since then, BTFP usage remained elevated, albeit at relatively consistent levels. On May 3, BTFP usage started to climb again, and reached record-level use in the first week of June.
May 2023 Cartoon: Bulls, Bears and Bots
May 2023 Cartoon: Bulls, Bears and Bots
COTW: Interest in AI
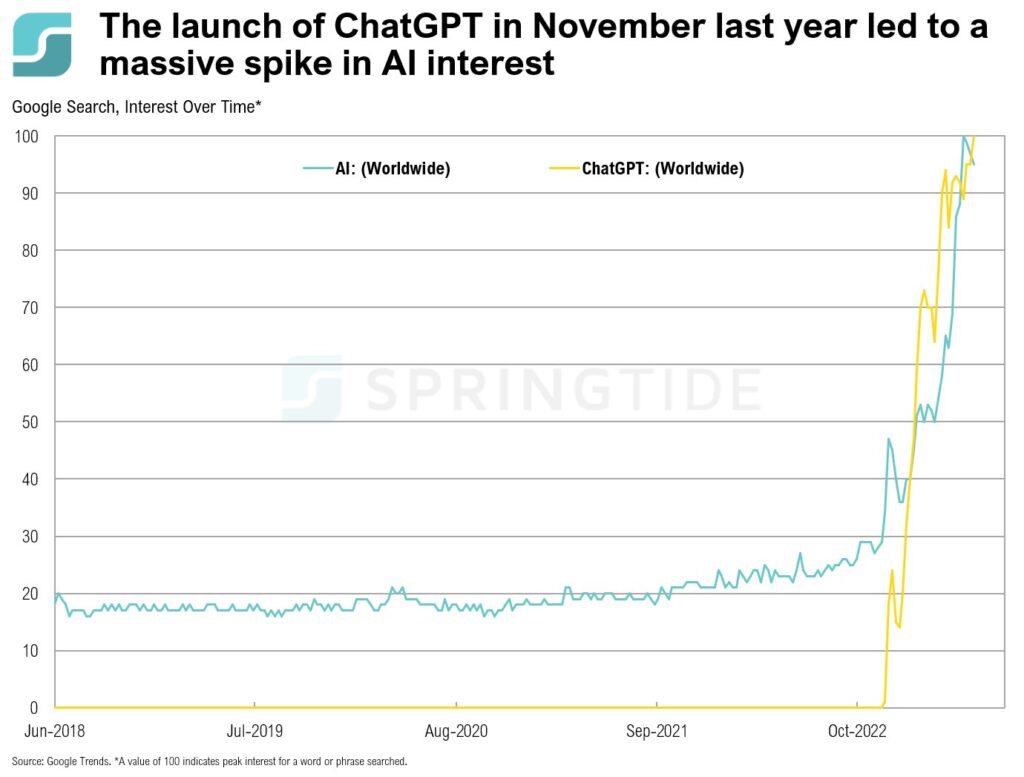
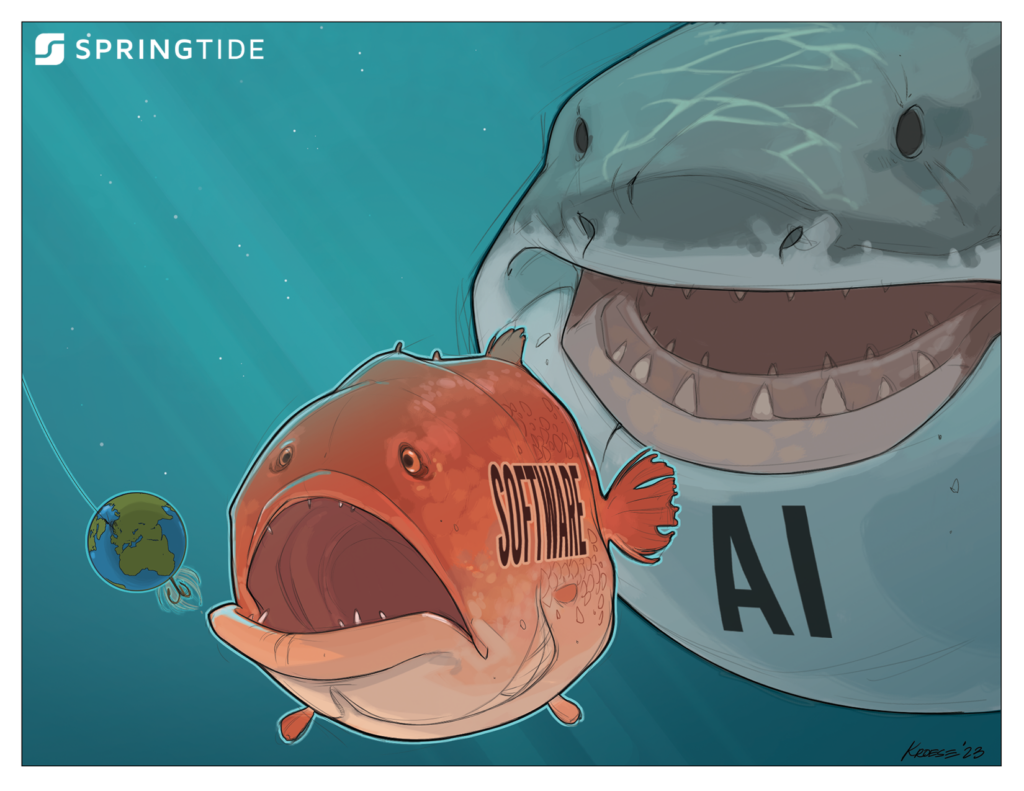
More recently, interest in AI has boomed, driven largely by the launch of ChatGPT in November last year.
COTW: Unstoppable Tech
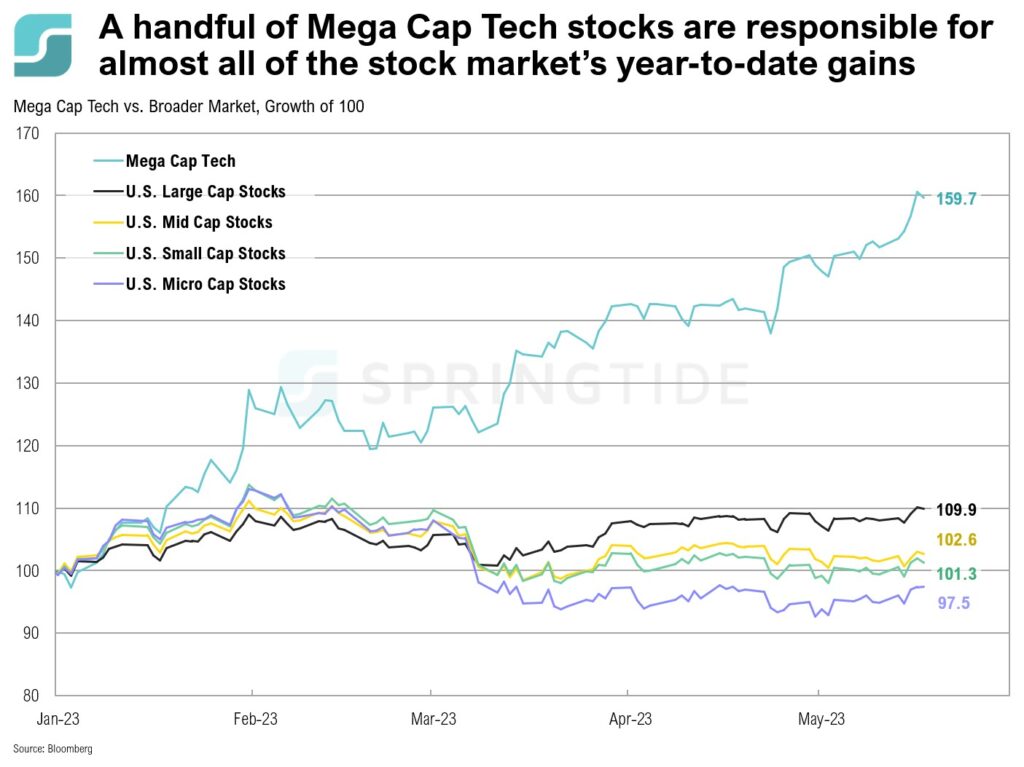
Overall, the S&P 500 is up 9.9% year-to-date. However, this perceived market strength is not indicative of the average public company’s performance. Instead, a handful of stocks—Meta, Apple, Microsoft, Amazon, Nvidia and Alphabet—have been driving market strength.
COTW: Longer-Term Inflation Expectations
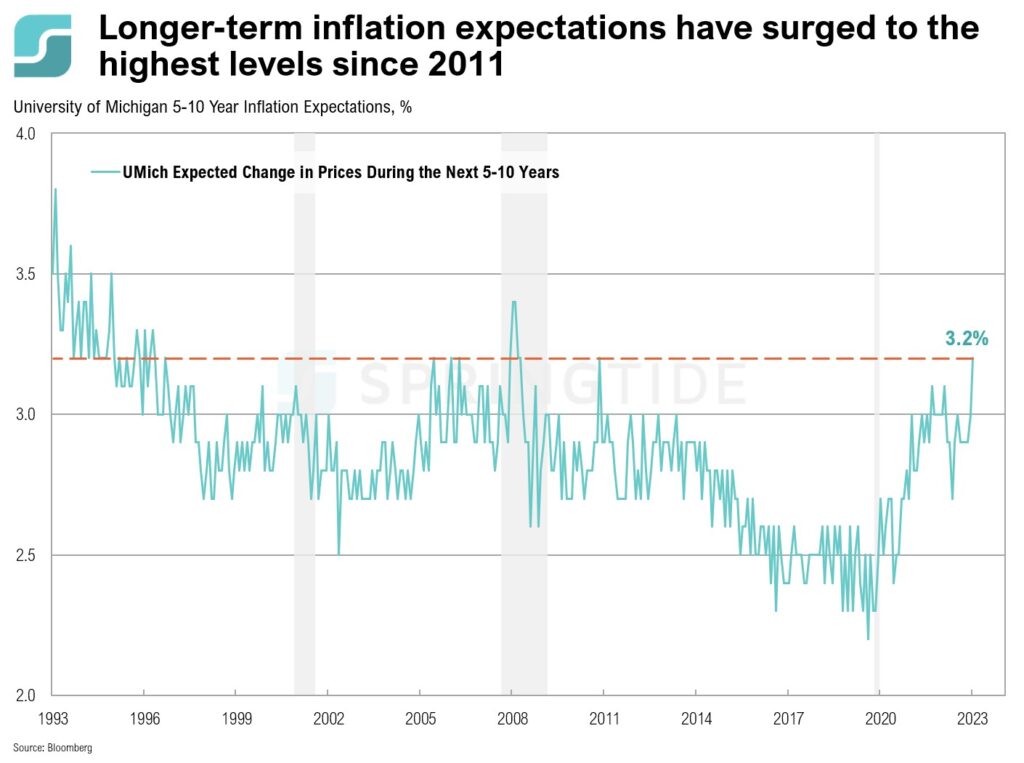
When asked during the latest FOMC meeting in early May whether the Fed would accept a prolonged period of 3% inflation, Fed Chairman Powell clearly reiterated their goal of lowering inflation to 2%, stating, “We’re not looking to reach 3% and drop our tools. We have a goal of getting to 2%.”
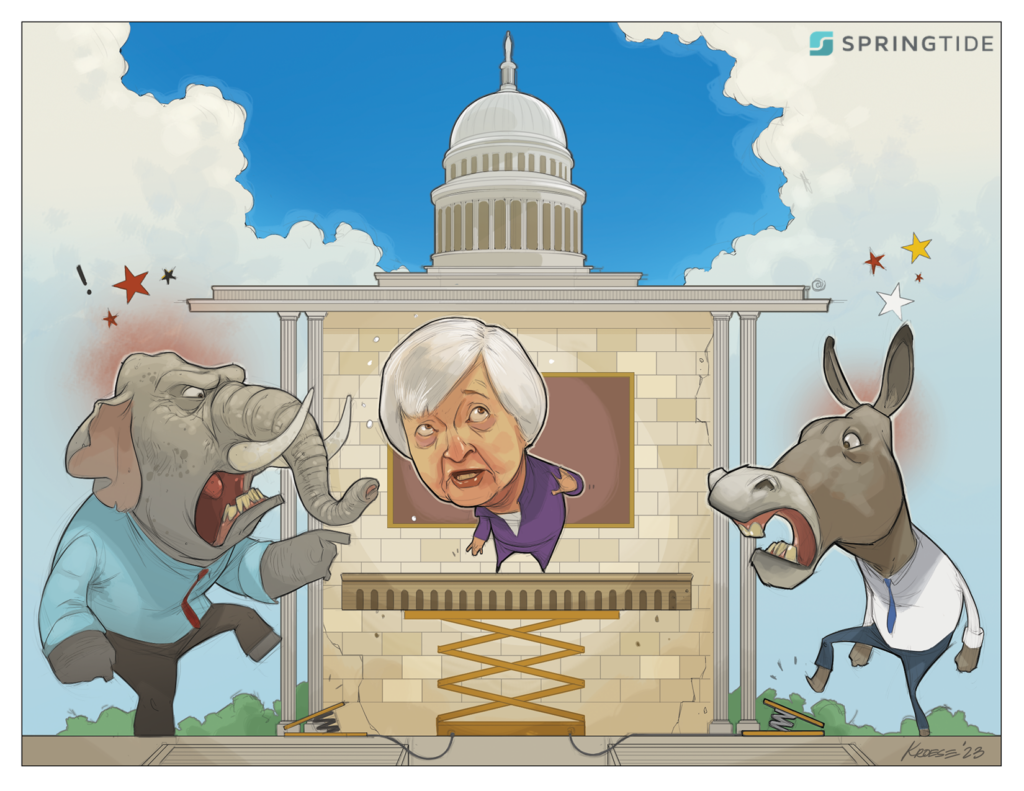
April 2023 Cartoon: A Series of Unfortunate Events
April 2023 Cartoon: A Series of Unfortunate Events
April 2023 Commentary: A Series of Unfortunate Events
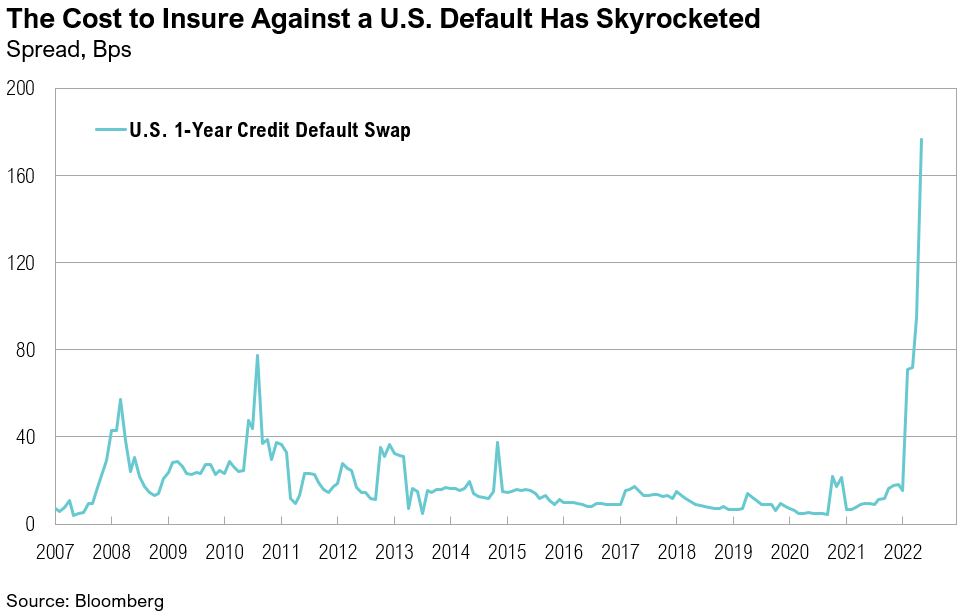
As the debt ceiling debate intensifies, Congress remains at an impasse and has largely ignored warnings from Treasury Secretary Yellen, who now estimates that the U.S. will run out of funds to pay bills by June 1.
COTW: Entrenched Inflation
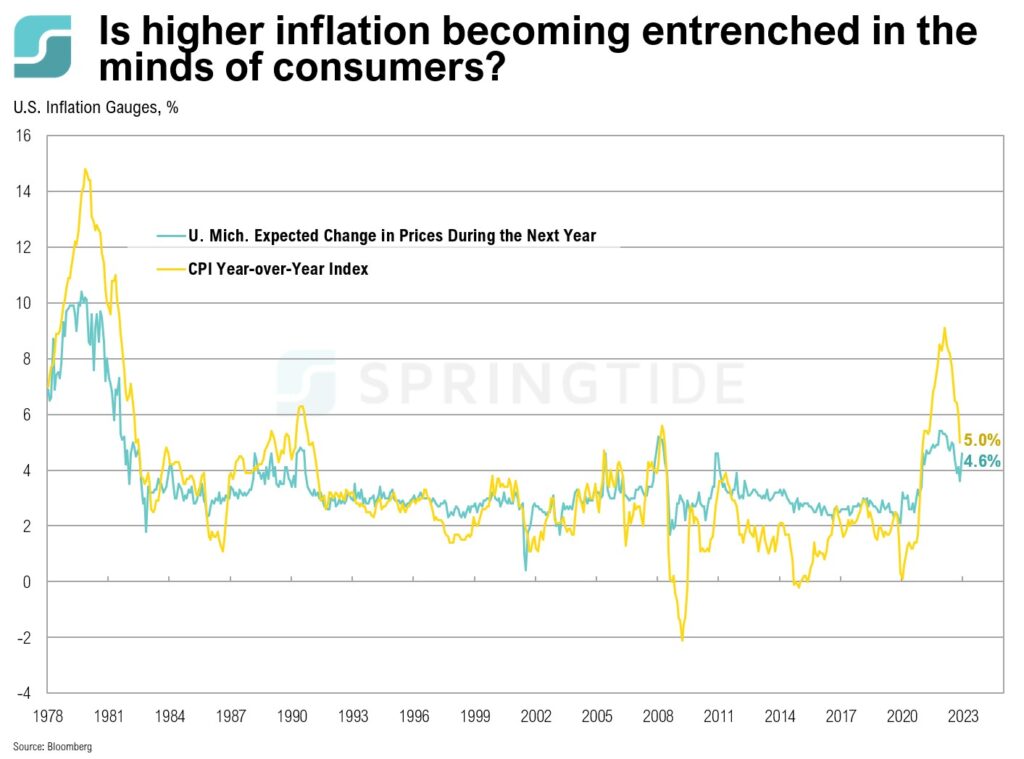
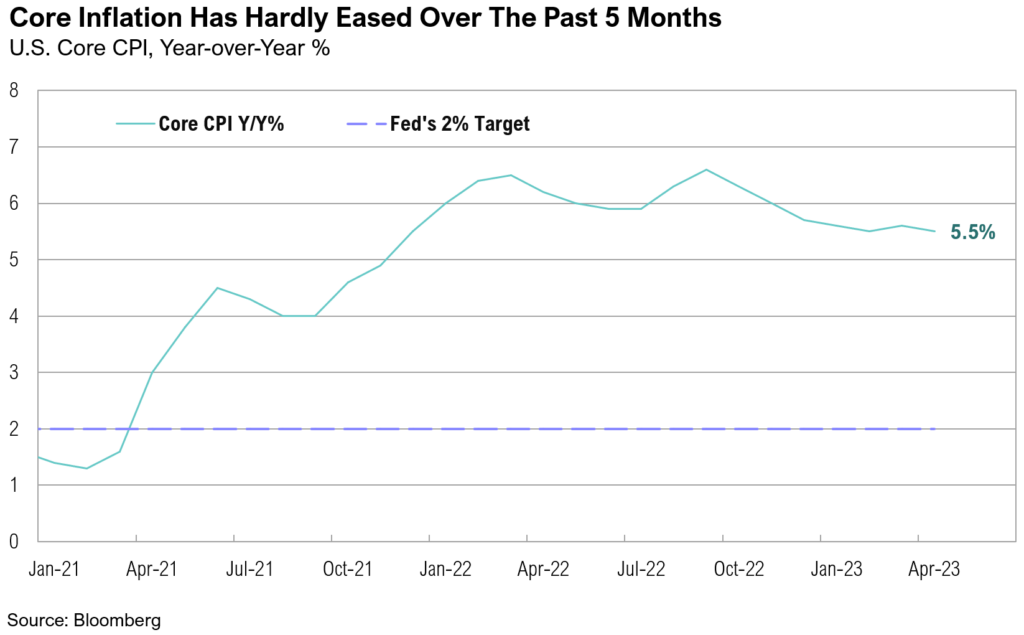
After peaking at 9.1% in June last year, the April CPI print shows that inflation has slowed to 5.0%, indicating the continued cooling of inflation off record-high levels. While this should have been a welcome sign for U.S. consumers of prices starting to ease, there has instead been an uptick in expectations of inflation remaining higher for longer.
1Q 2023 Commentary: Tick Tock
Despite a barrage of economic and policy news, the quarter will be remembered most for the failures of Silicon Valley Bank and Signature Bank.
COTW: The Consumer Squeeze
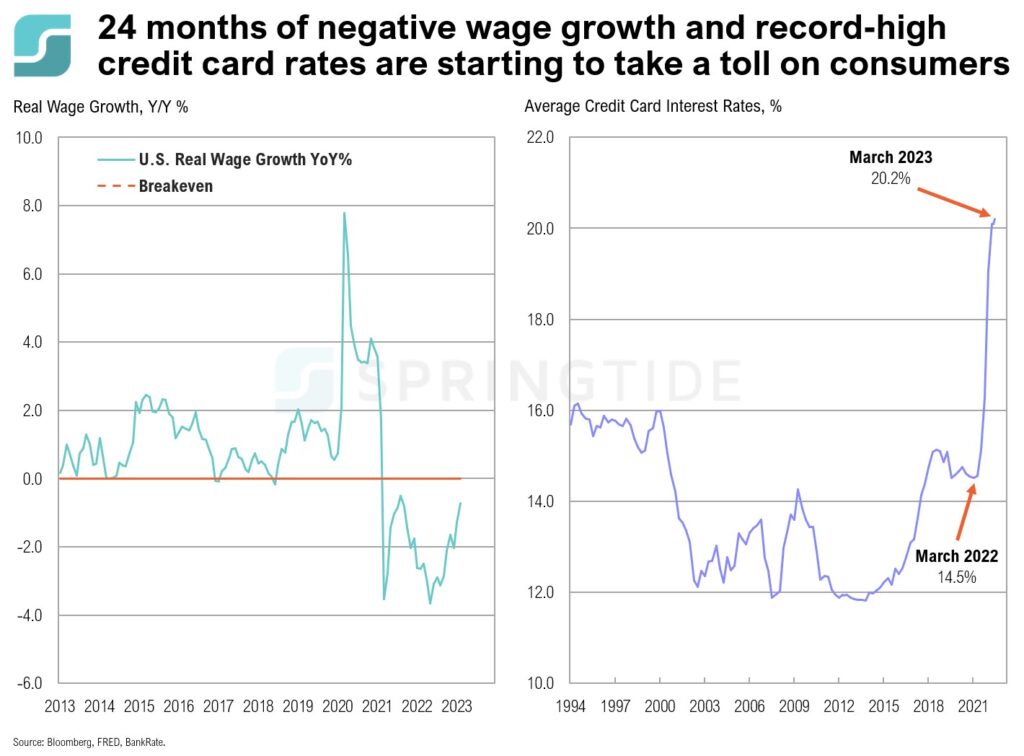
The latest CPI print seems to show good news: Inflation increased by 5.0% year-over-year, and is finally showing signs of easing after peaking at 9.1% in June 2022. However, this is still well above the Federal Reserve’s 2.0% target, which means that there’s still a way to go before prices stabilize.
March 2023 Cartoon: Tick Tock
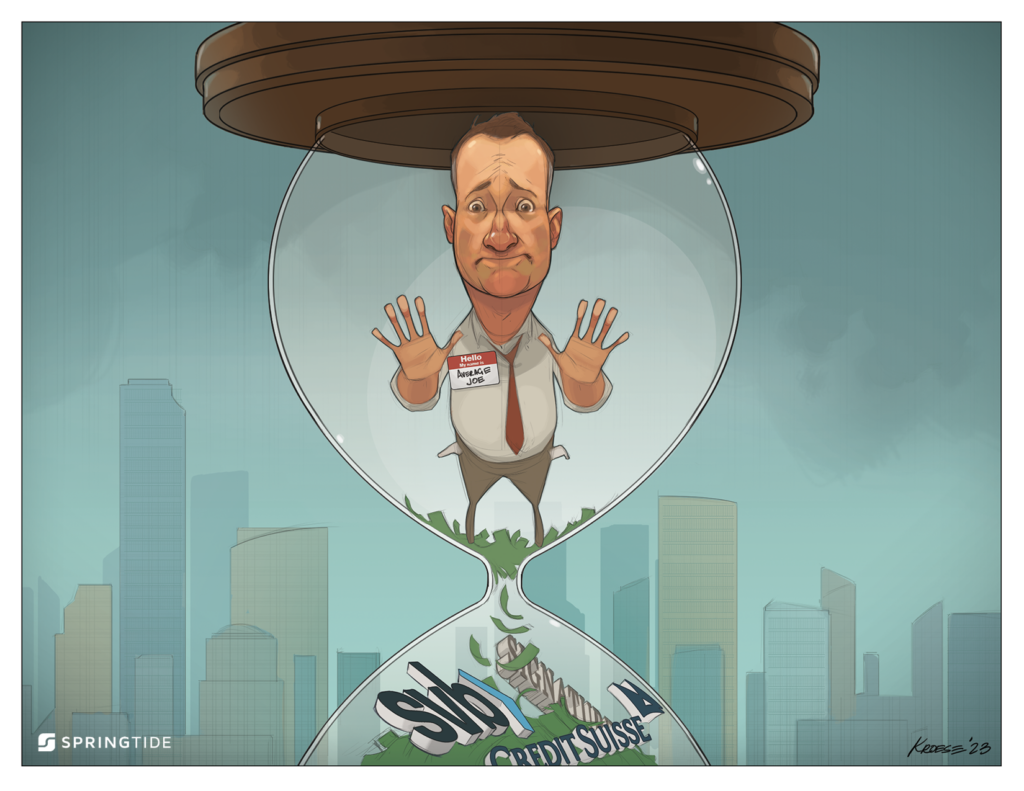
March 2023 Cartoon: Tick Tock
COTW: Tighter Lending Standards
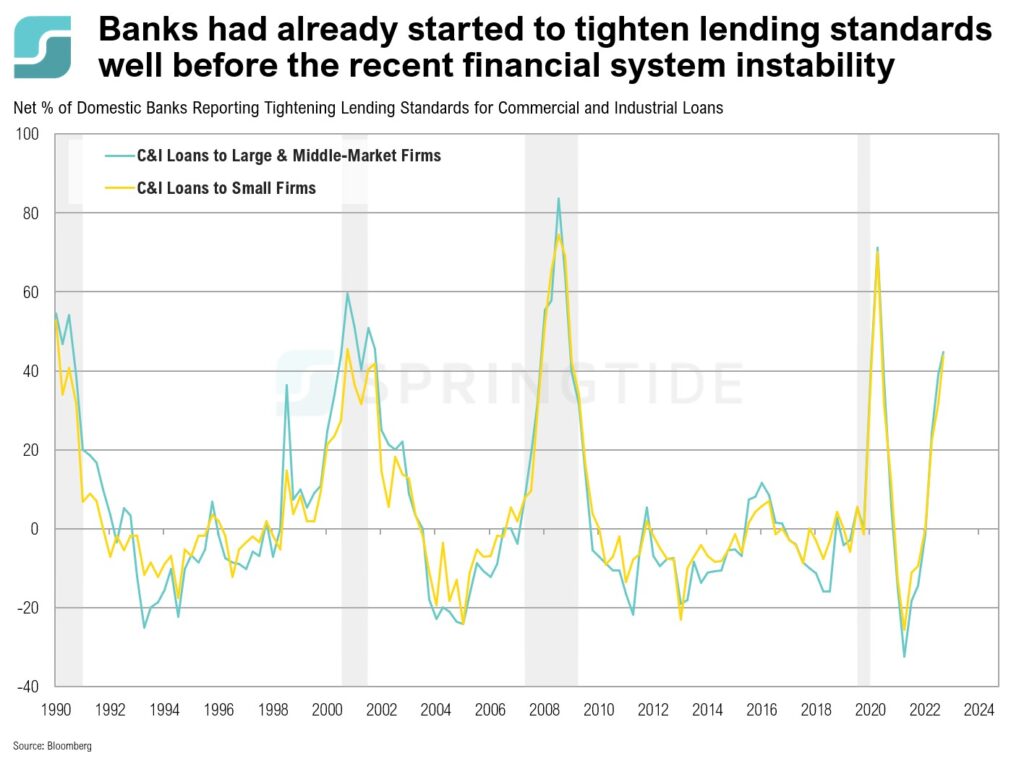
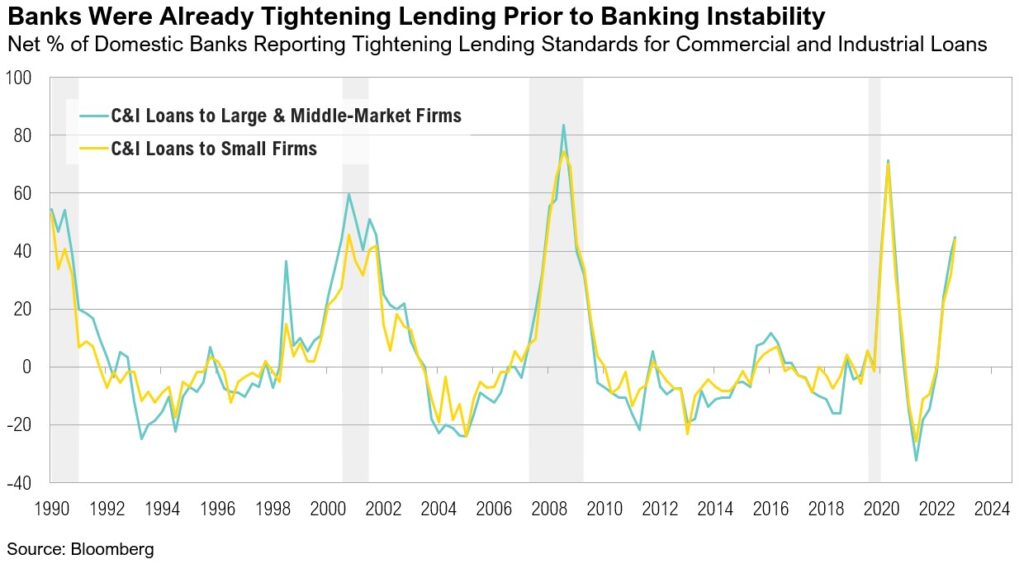
Long before the collapse of Silicon Valley Bank and Signature Bank, U.S. banks had started to report tightening lending standards for commercial and industrial loans for firms of all sizes. The chart below shows how, throughout the first two months of the year, at least 44% of domestic banks have reported tightened lending standards. With Q1 2023 data due in May, which will include the impact of the recent financial stability, expectations are for banks to accelerate loan tightening conditions.
1Q, 2023 Asset Class Return Quilts
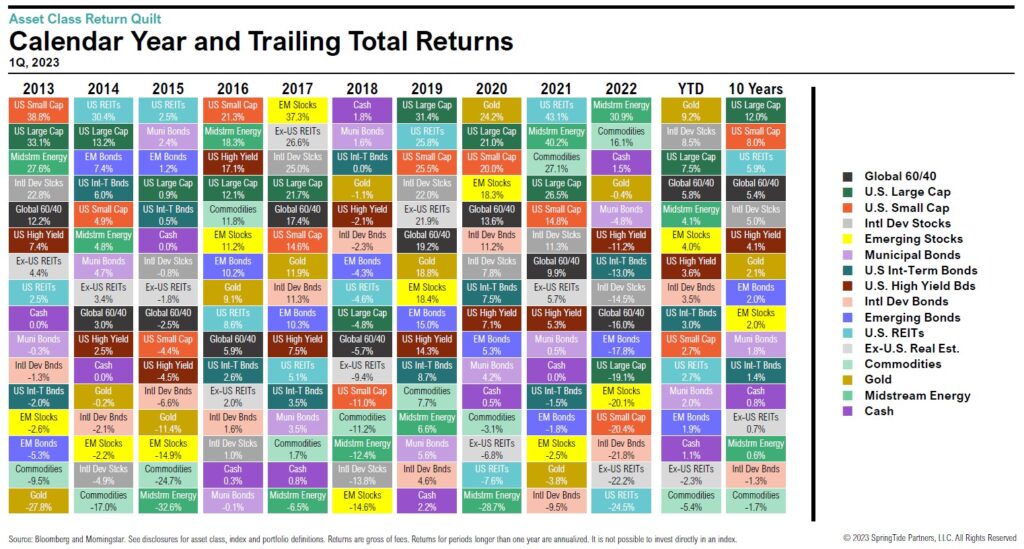
It was a great start to the year for markets, as the majority of asset classes ended the first quarter with positive returns.
COTW: Sticky Inflation Measures
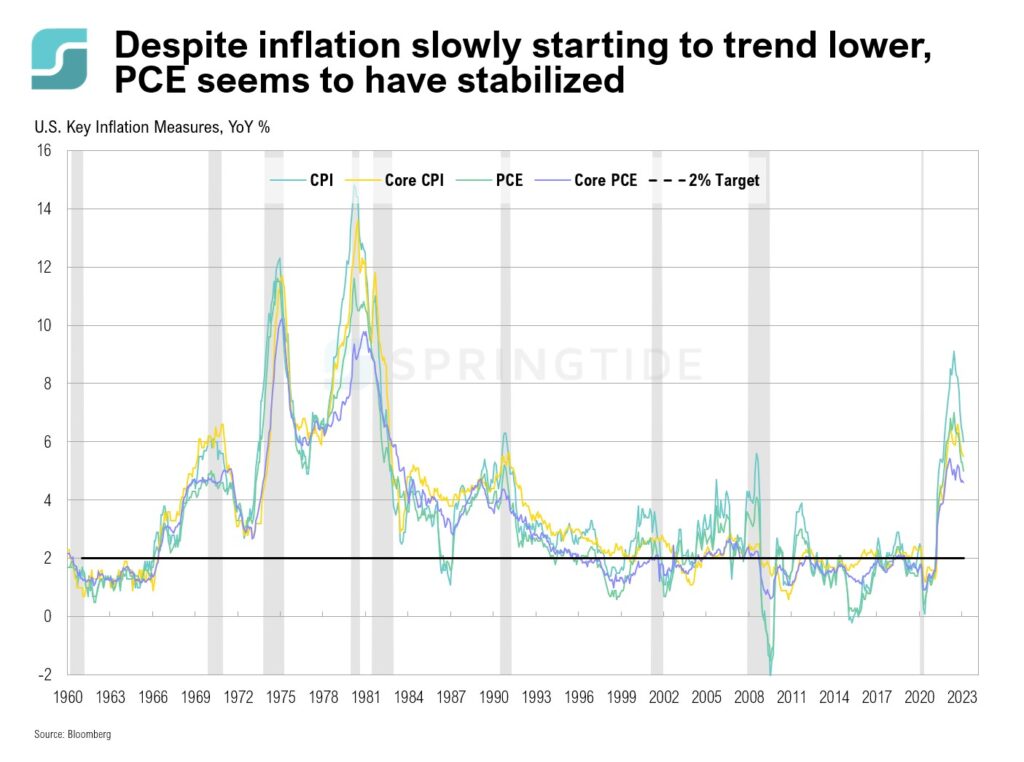
Last week, several important inflation measures were released. The Personal Consumption Expenditure (PCE) Price Index moved down to 5.0% in February, from 5.3% in January. However, since its peak of 7.0% in June 2022, there has been only a very slow downward trend over the last 9 months. It remains well above its 20-year average and the Fed’s target of 2.0%.
COTW: Extreme Interest Rate Spreads
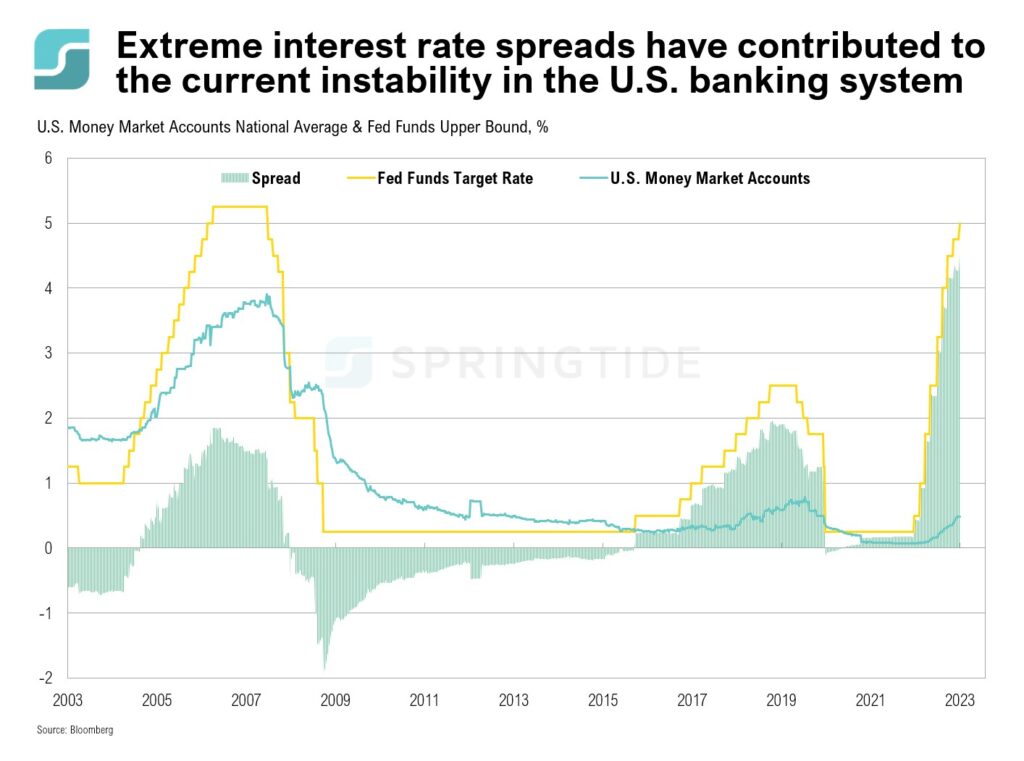
The spread between interest paid on a bank’s liabilities (e.g. deposits) and the interest received on assets (e.g. investments), known as the Net Interest Margin (NIM), is a key driver of bank profitability. Banks generally benefit from higher interest rate environments as they are able to delay raising interest on deposits, while benefitting from higher interest income from investments.
COTW: SVB Fallout and the Fed’s Rate Hike Path
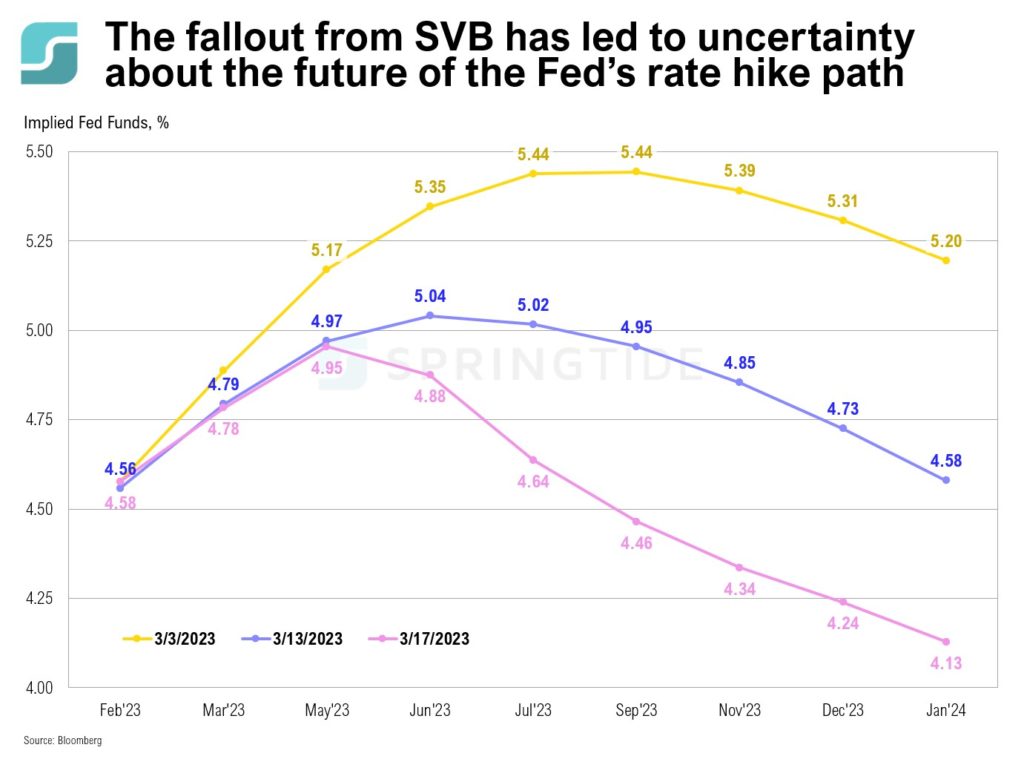
Last month, the Federal Reserve slowed the pace of rate hikes, increasing interest rates by 0.25%, following a 0.50% rate hike in December and three consecutive 0.75% hikes at the three prior meetings. In early March, following a series of strong economic data releases in February, expectations were for interest rates to reach a high of 5.44% in July this year, before dropping down to 5.31% at the end of 2023.
February 2023 Commentary: The Money Illusion
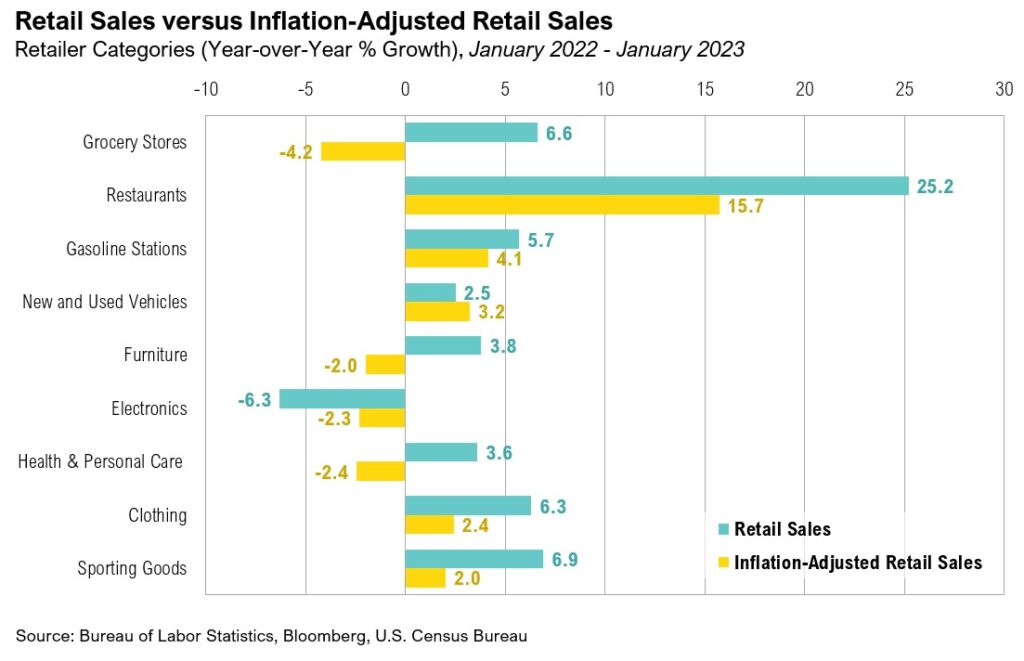
Retail sales rebounded in January, following two consecutive months of declines. However, the impact of ongoing elevated inflation on consumers’ purchasing power remains unclear, as inflation creates an illusion of strength that is not carried through to inflation-adjusted data.
COTW: Its Been a Tough Couple of Years for U.S. Intermediate-Term Bonds
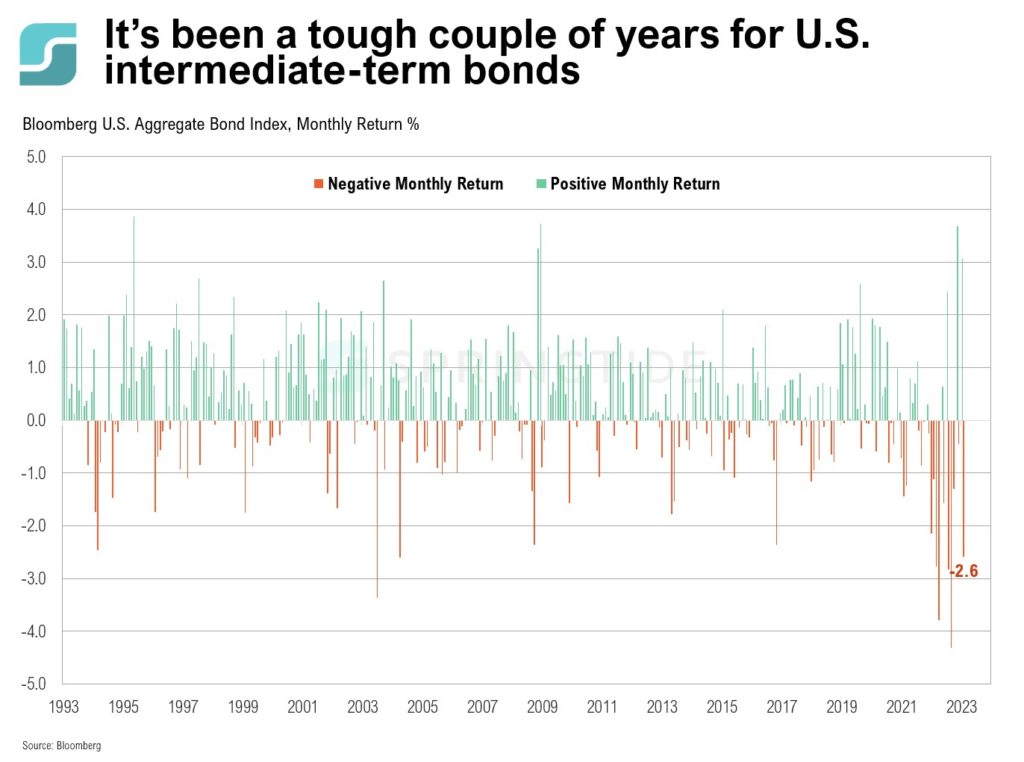
U.S. intermediate-term bonds haven’t had a good couple of years. In 2022, the U.S. Bloomberg Aggregate Bond Index ended the year down 13%—the worst year since the inception of the Index in 1972
COTW: Inflation and the S&P 500
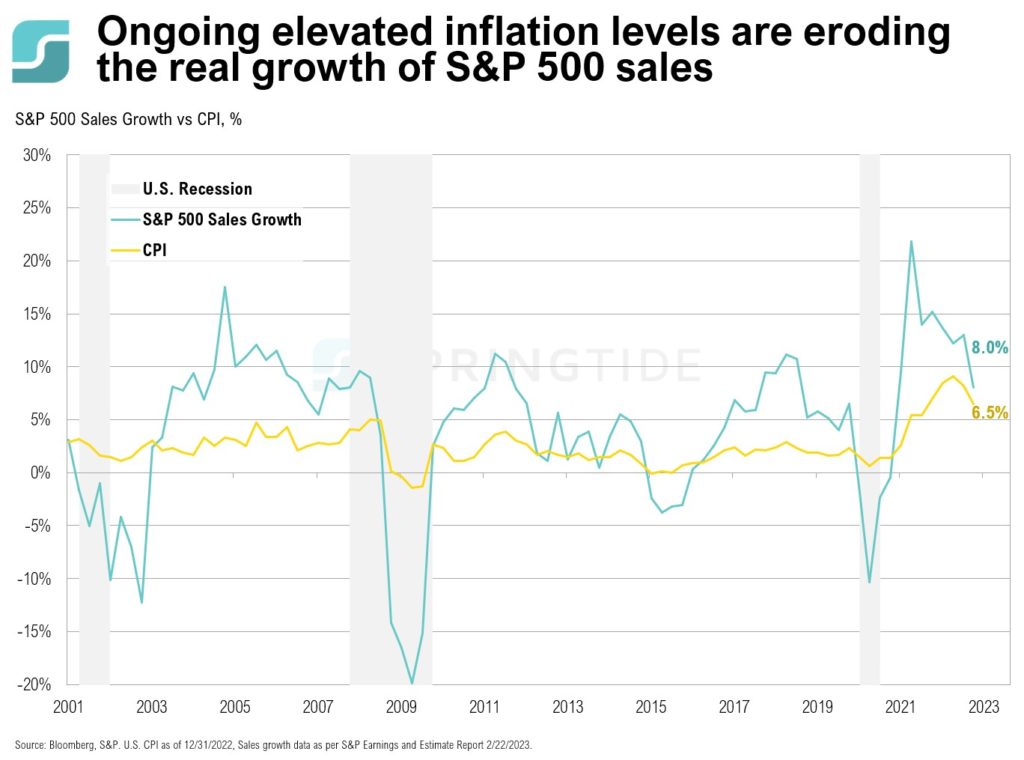
January’s inflation print showed inflation increasing 0.5% month-over-month, to 6.4%. A monthly reading of 0.5% or higher is rare, as there have only been five occasions that inflation has increased by 0.5% or more month-over-month between the Global Financial Crisis in 2008 and 2020. While ongoing elevated levels of inflation are having a material impact on consumers and the prices for goods and services, it is also having an impact on the relative strength of U.S. companies.
January 2023 Commentary: Faith, Trust and Pixie Dust
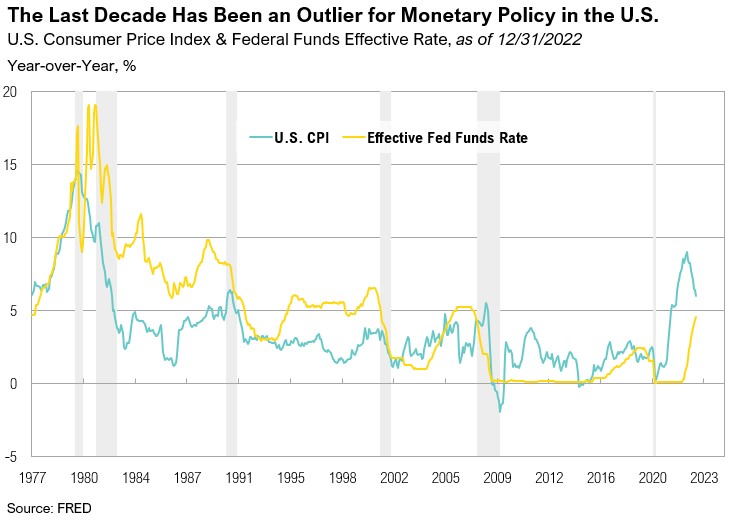
It’s been a great start to the year for markets; both stocks and bonds ended January with decidedly positive returns. The NASDAQ Composite enjoyed its best January since 2001, ending the month up 10.7%.
COTW: Growth and Value Indices
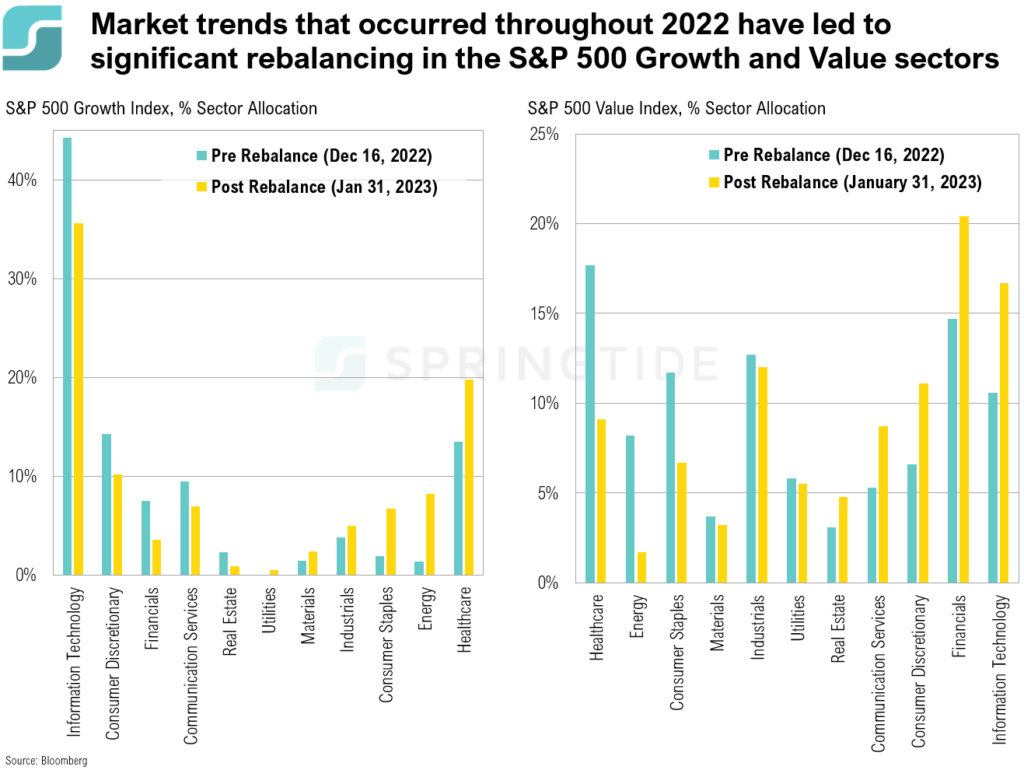
The S&P 500 Value and S&P 500 Growth indices are two style indices designed to provide investors with exposure to the market’s value and growth segments, with constituents in the indices taken from the S&P 500. Each year, these indices are rebalanced. The 2022 annual rebalancing, which occurred on December 16 2022, saw record turnover, as market trends throughout the year impacted the style classification of many companies—resulting in notable changes in sector exposure in the Growth and Value indices.
COTW: Personal Savings
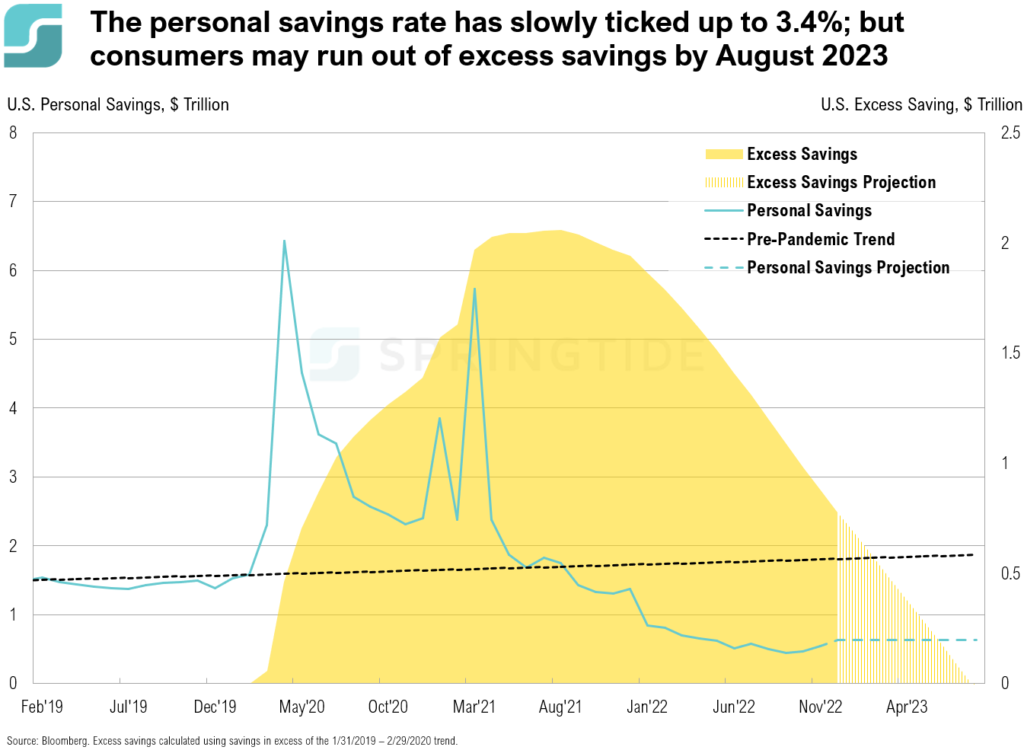
During the COVID-19 pandemic, U.S. consumers accumulated more than $2 trillion in excess household savings, enabling them to spend and to continue spending even as inflation reached decade-high levels. In April 2020, personal saving rates reached an all time high of 33%. However, since then, it has steadily declined, reaching 2.4% in September 2022—the lowest levels since 2005. It slowly started ticking up after September, reaching 3.4% in December, albeit still well below the historical average of 8.9%.
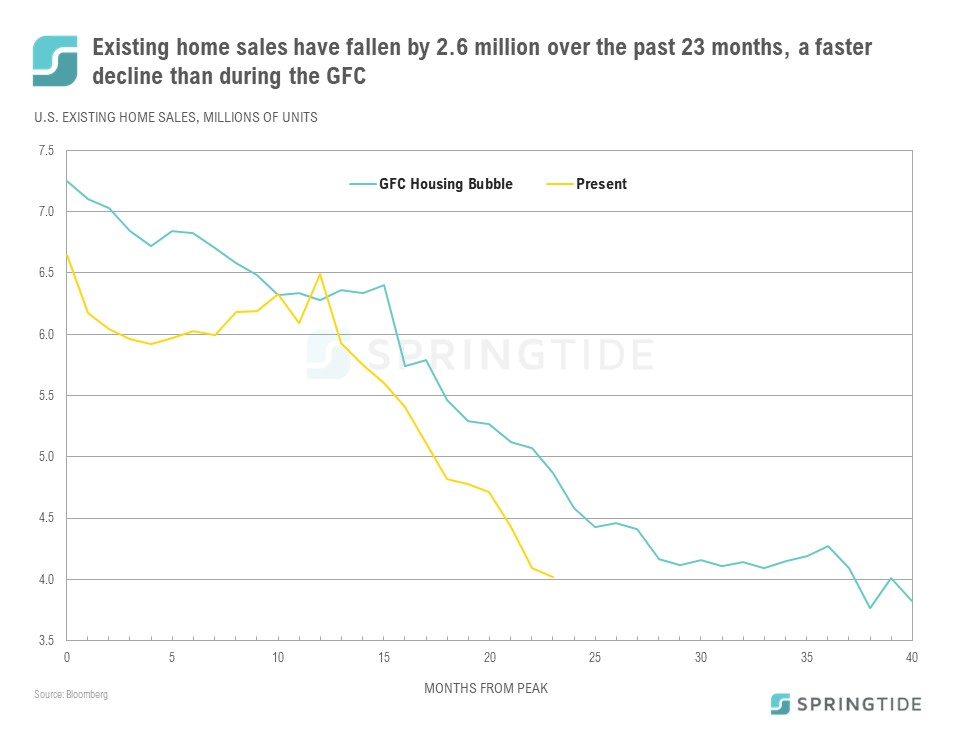
COTW: Existing Home Sales – Now vs GFC
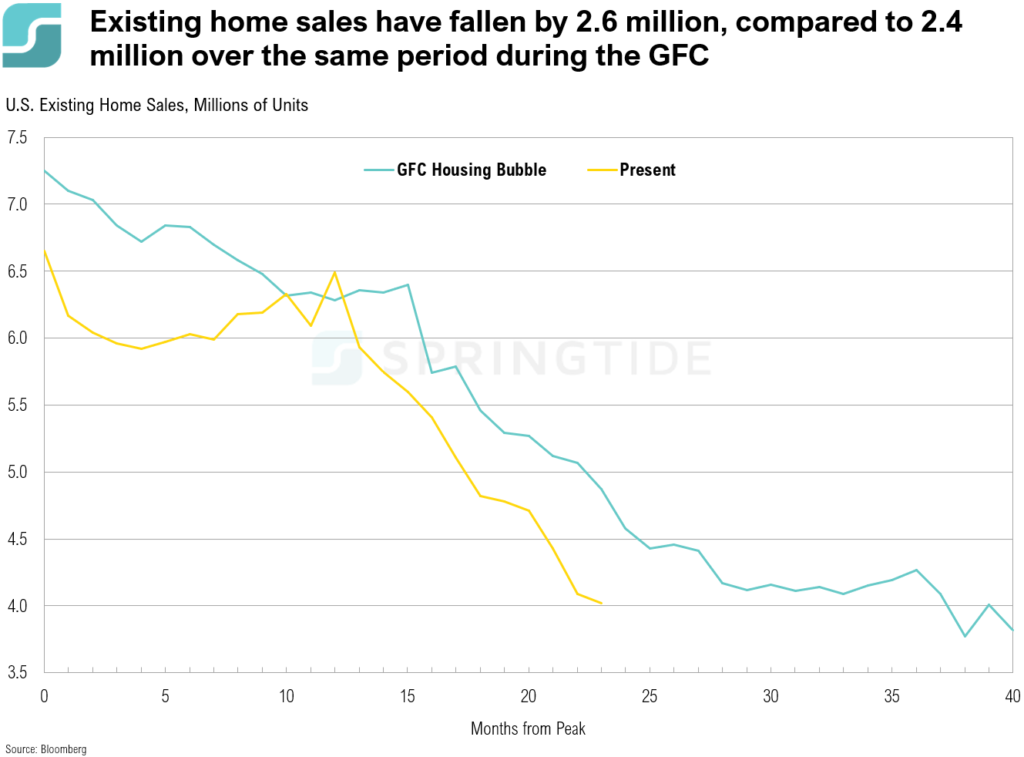
Existing home sales have fallen by 2.6 million over the past 23 months, compared to a 2.4. million decline over the same period during the Global Financial Crisis.
COTW: Is It About The Journey or The Destination?
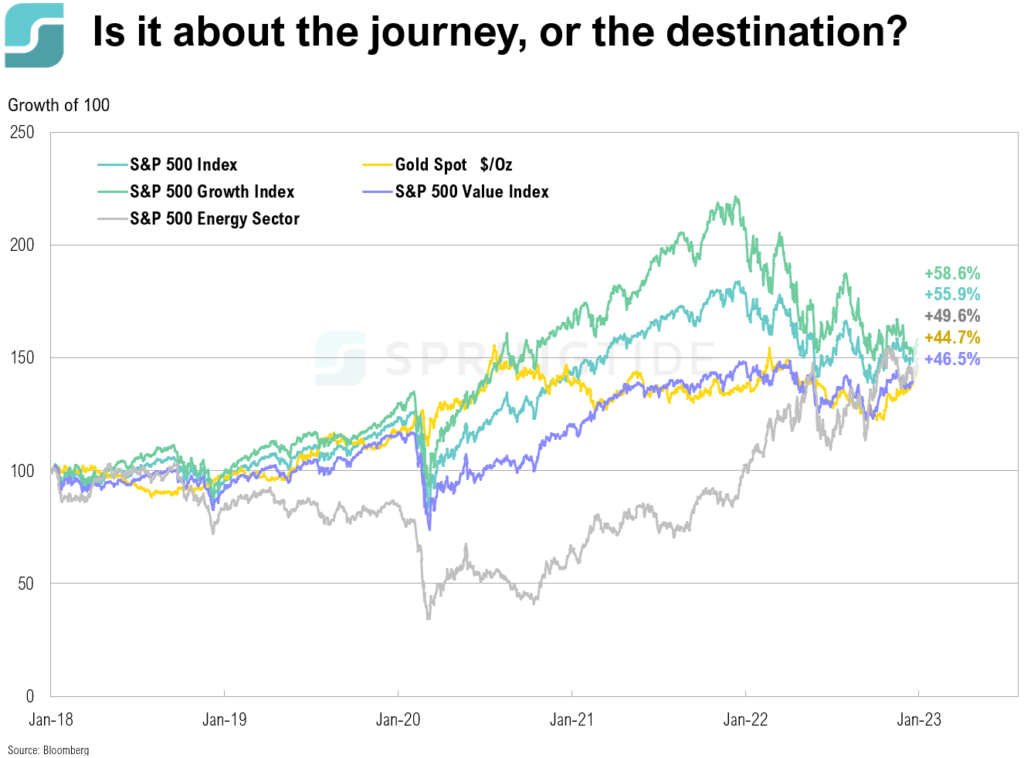
While the journey of the asset classes, styles and sectors below may have taken very different paths over the last five years, their returns have nearly converged.
4Q 2022 Commentary: Money Like Water
As inflation showed signs of slowing in the fourth quarter, both stocks and bonds recovered some of their losses from previous quarters, and most assets ended the quarter with positive returns.
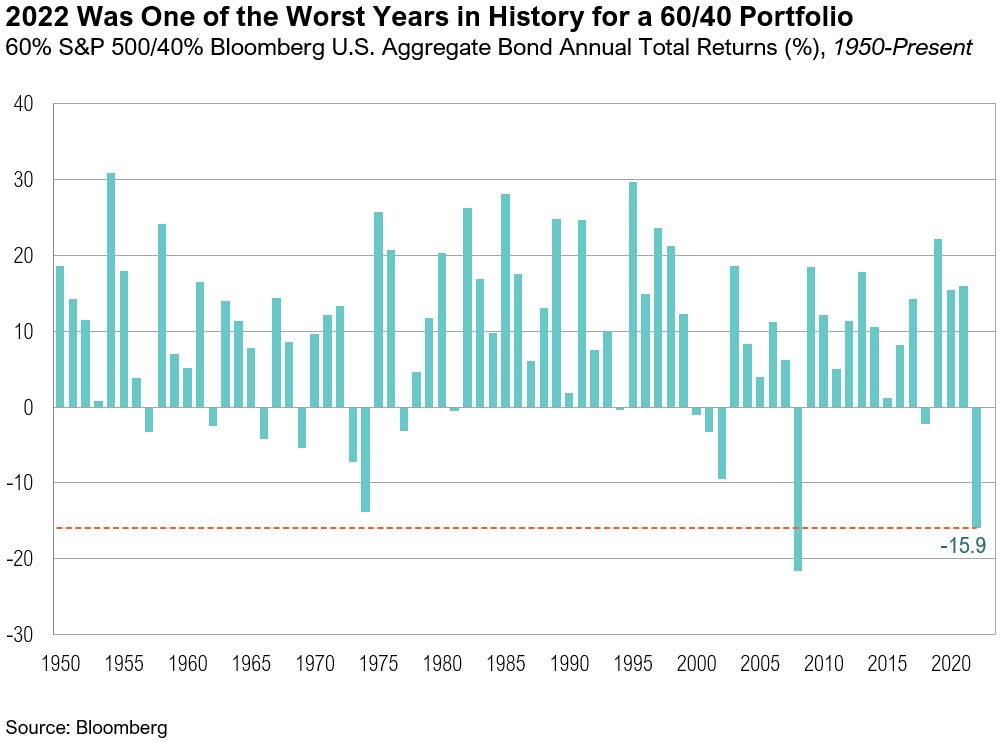
COTW: 2022 Market Recap
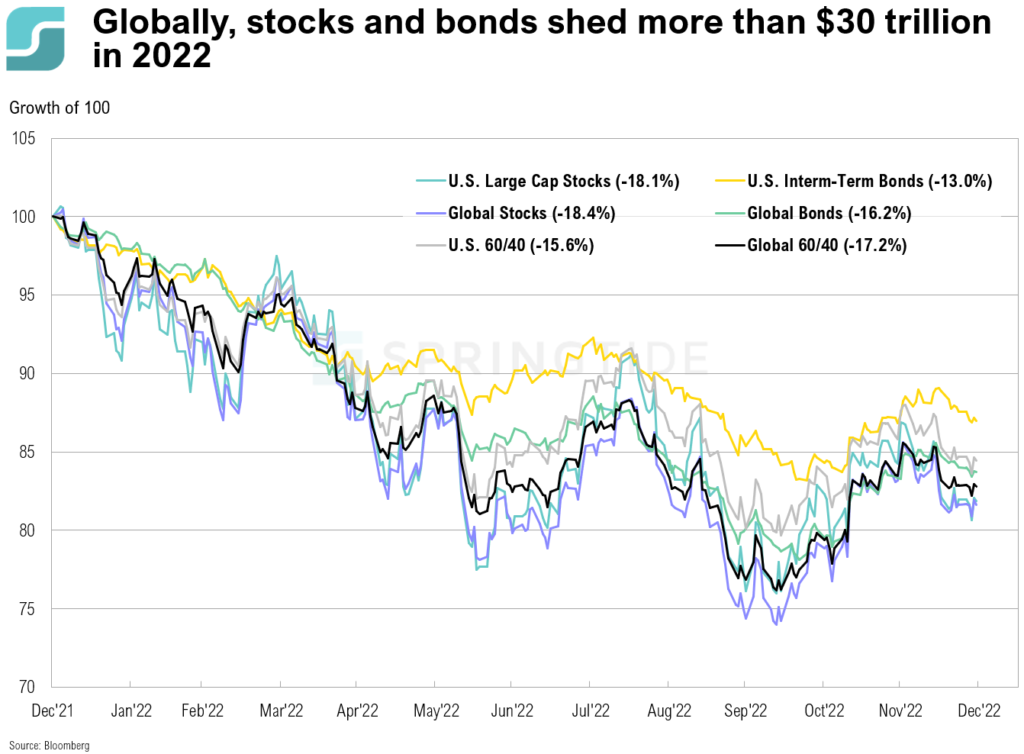
2022 was one of the worst years for markets since the 2008 Global Financial Crisis. Record-high levels of inflation and subsequent aggressive monetary policy reactions by central banks across the globe saw both stocks and bonds tumble.
December 2022 Cartoon: Money Like Water
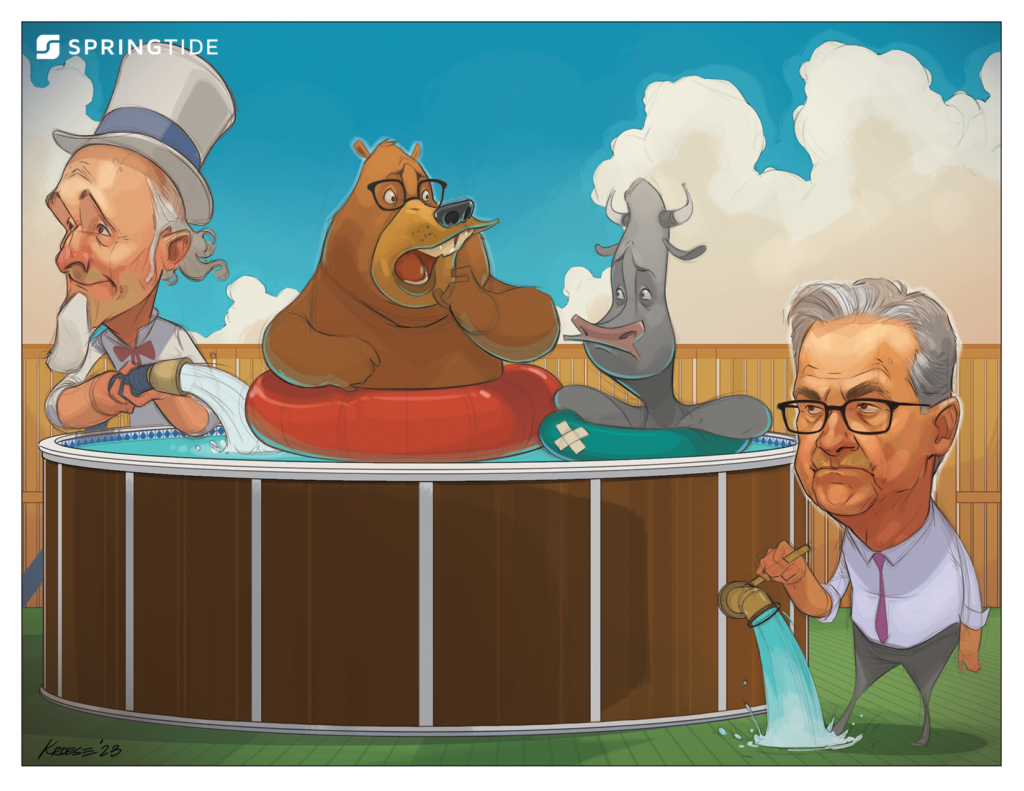
December 2022 Cartoon: Money Like Water
4Q, 2022 Asset Class Return Quilts
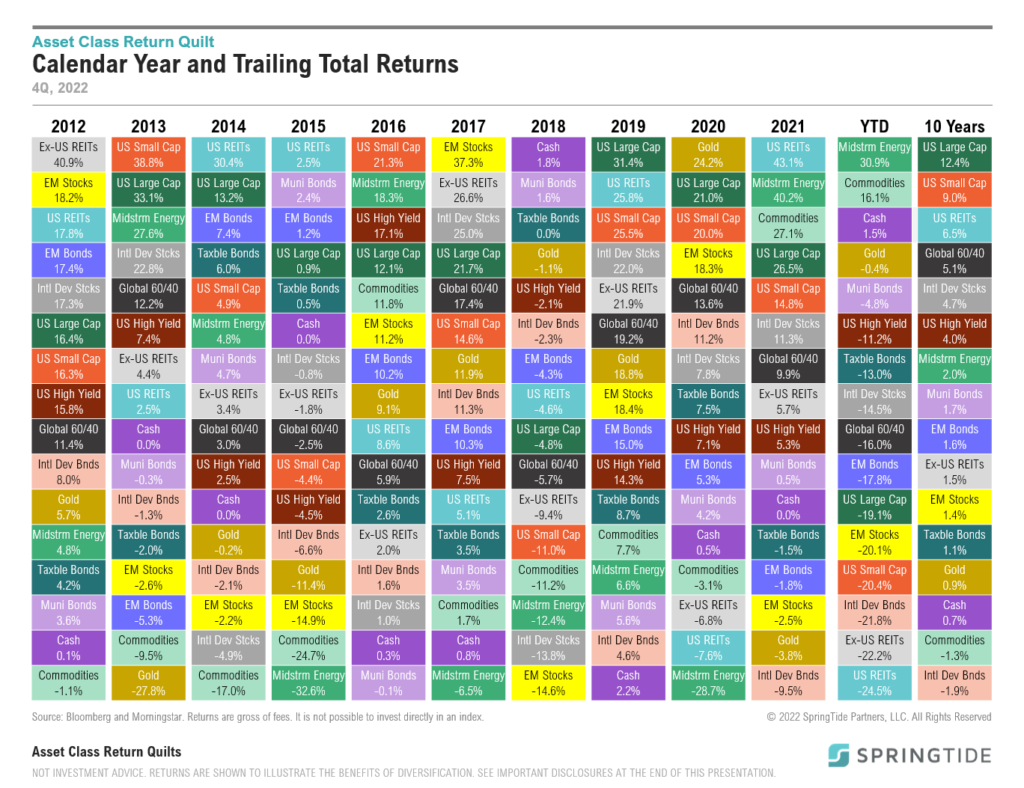
Midstream energy ended the year as the top-performing asset class, returning 30.9%.
November 2022 Commentary: A Fork in the Road
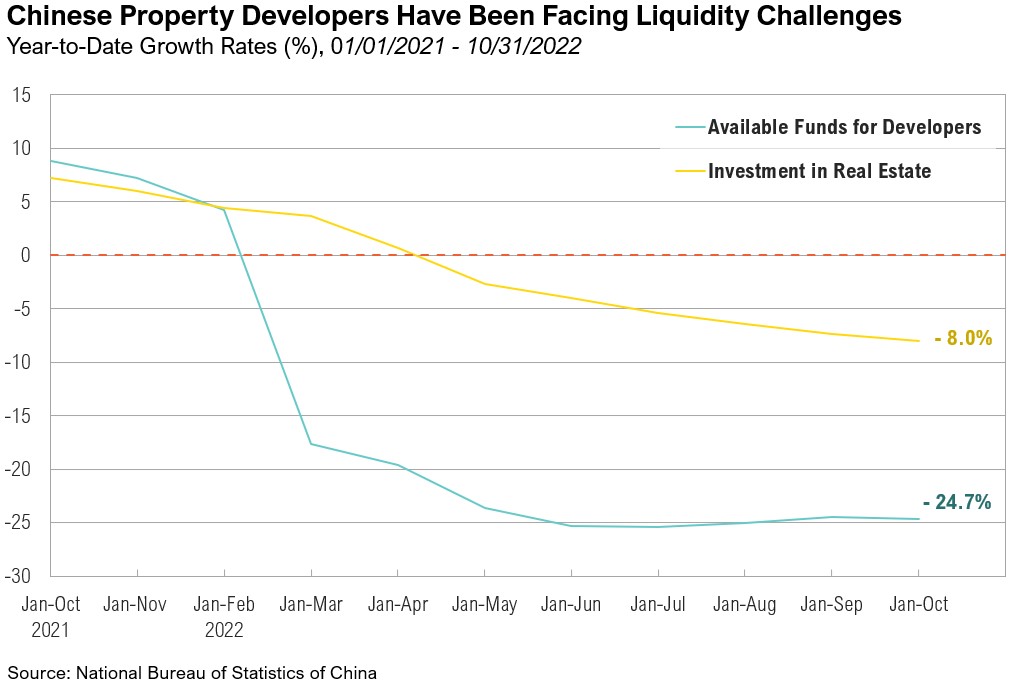
Two of the most powerful economies in the world, the U.S. and China, are both facing critical decisions, and their choices will create ripple effects for global economic growth.
November 2022 Cartoon: A Fork in the Road

November 2022 Cartoon: A Fork in the Road
COTW: The U.S. Debt Ceiling
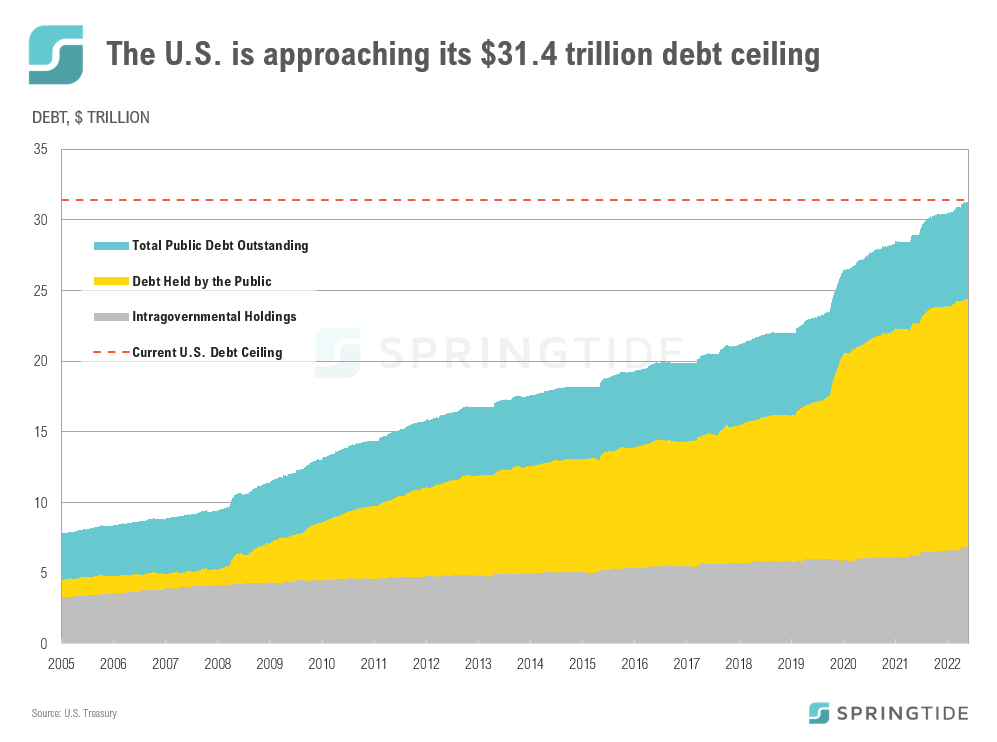
Created in 1917, the U.S. debt ceiling limits the amount the federal government can owe. It was initially used as a tool to make it easier for government to borrow money. Currently, the U.S. debt ceiling is set at just under $31.38 trillion.
COTW: Resilient Retail Sales
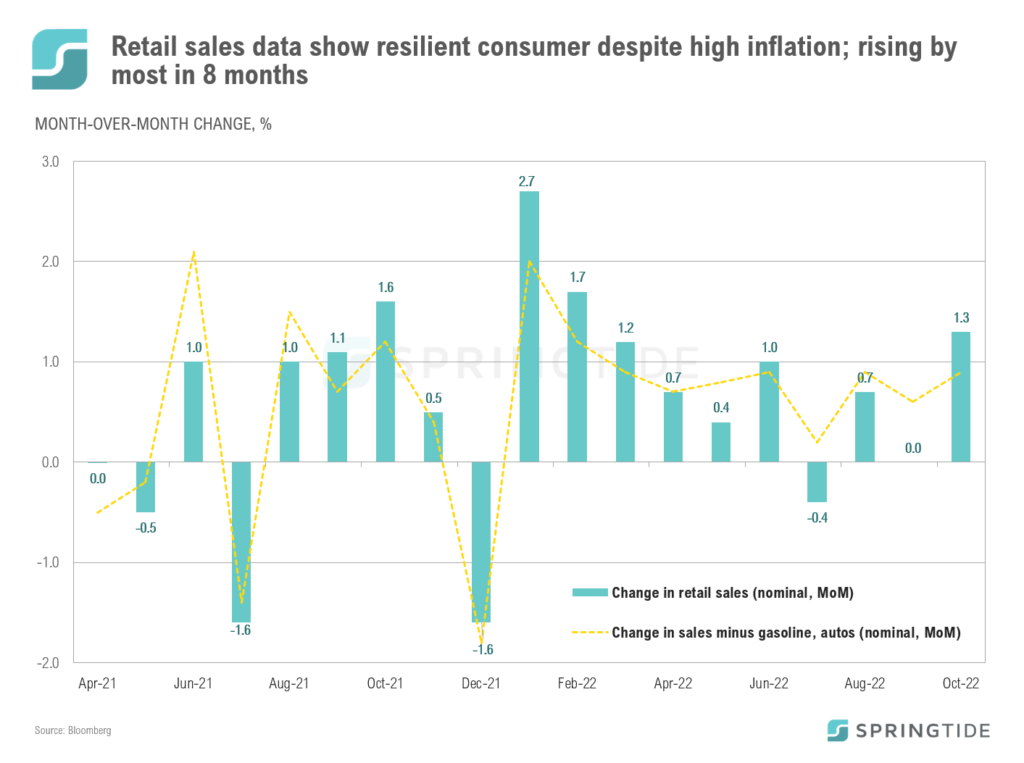
U.S. retail sales data was released last week, exceeding expectations and proving resilient in the face of high inflation and continued rate hikes by the Fed. Headline retail sales rose +1.3% in October, exceeding the expectation of +1.0%.
COTW: Financial Conditions
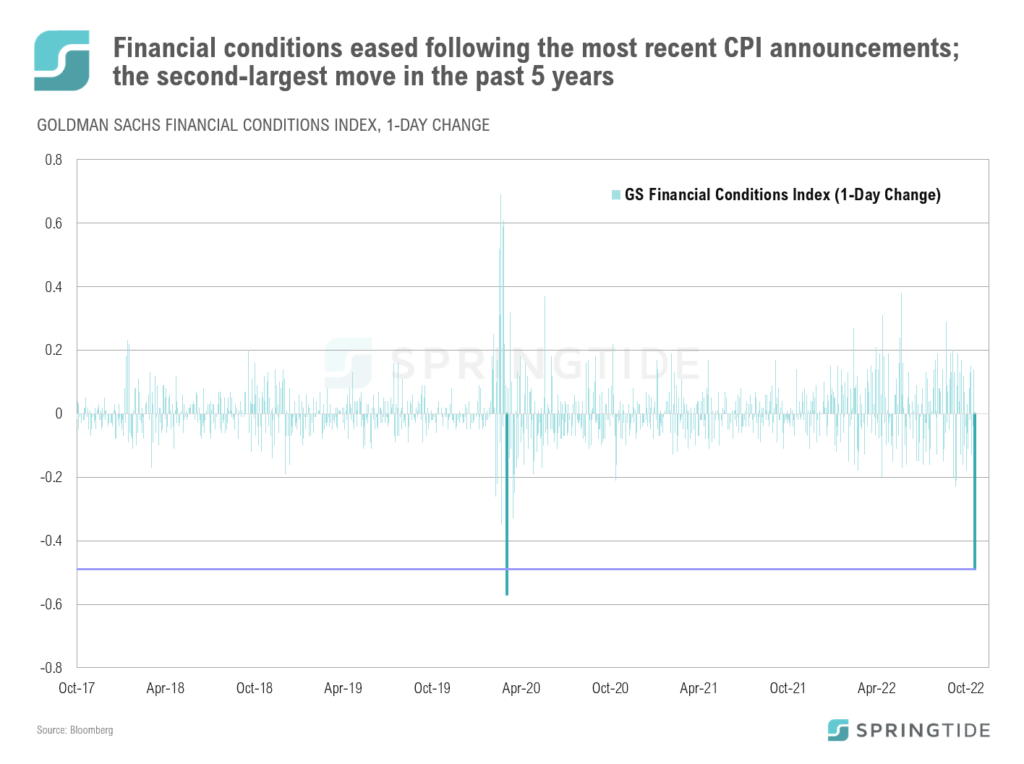
The Goldman Sachs U.S. Financial Conditions Index tracks the current position of financial variables in the U.S. that influence economic activity and therefore the future state of the economy. The index includes variables such as short- and long-term interest rates, U.S. dollar strength, credit spreads, and equity valuations. The higher the index, the tighter financial conditions, and vice-versa.
October 2022 Commentary: De-FAANGed
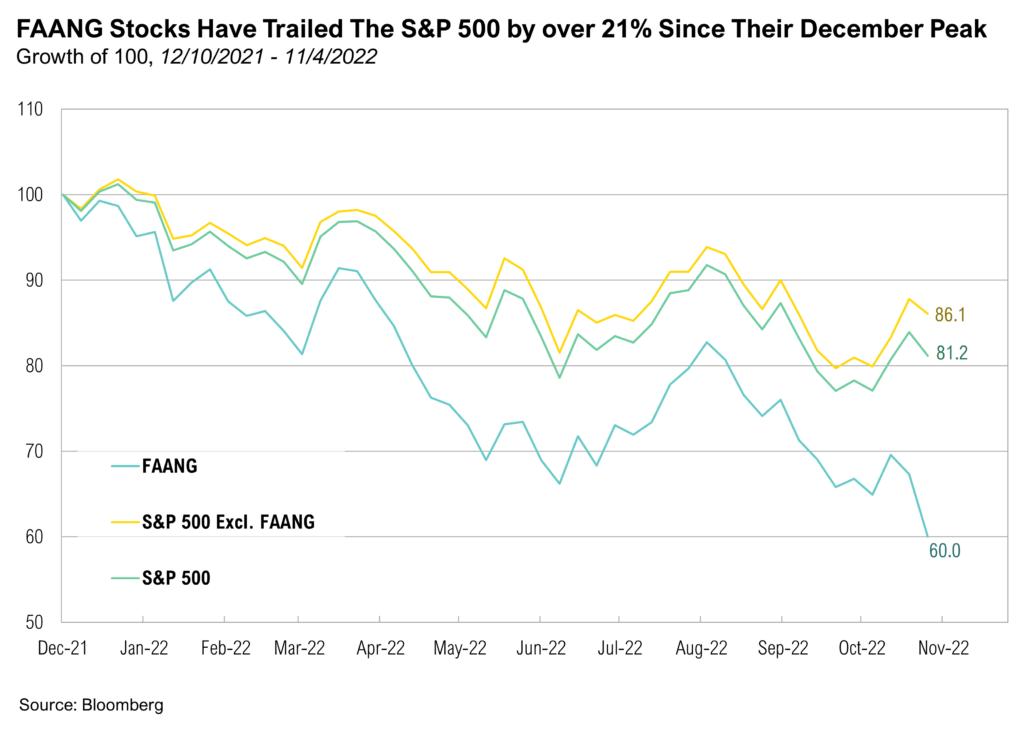
The reversal of FAANG stocks’ long-term dominance has loomed large over markets this year.
October 2022 Cartoon: De-FAANGed

October 2022 Cartoon: De-FAANGed
COTW: Not All Tech Companies Are Built Equal
Like most bear market environments, 2022 has seen growth stocks materially underperform their value counterparts. Of the growth stocks, tech has been among the hardest hit, with the S&P 500 tech sector down 33% year to date — trailing the broader index by over 8.0%. One of the key contributors to the underperformance of growth, and tech, has been the sharp rise in interest rates over the year.
3Q 2022 Commentary: Whac-A-Mole
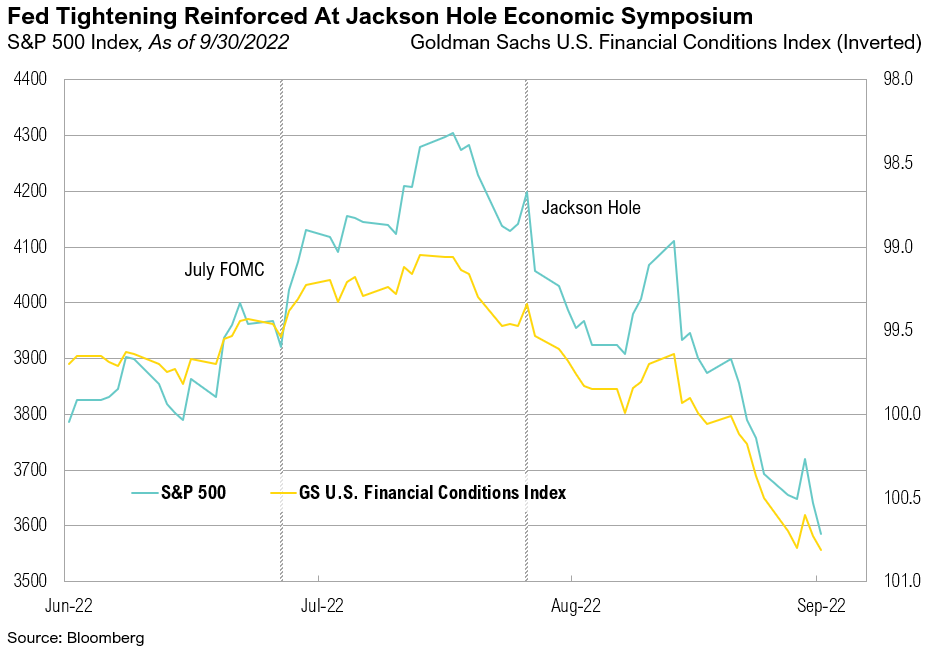
In the first half of the quarter, stocks and bonds rallied on the hopes of a Fed policy pivot, but a sharp reversal in the second half brought new highs for bond yields and new lows in stocks for the year.
3Q, 2022 Asset Class Return Quilts
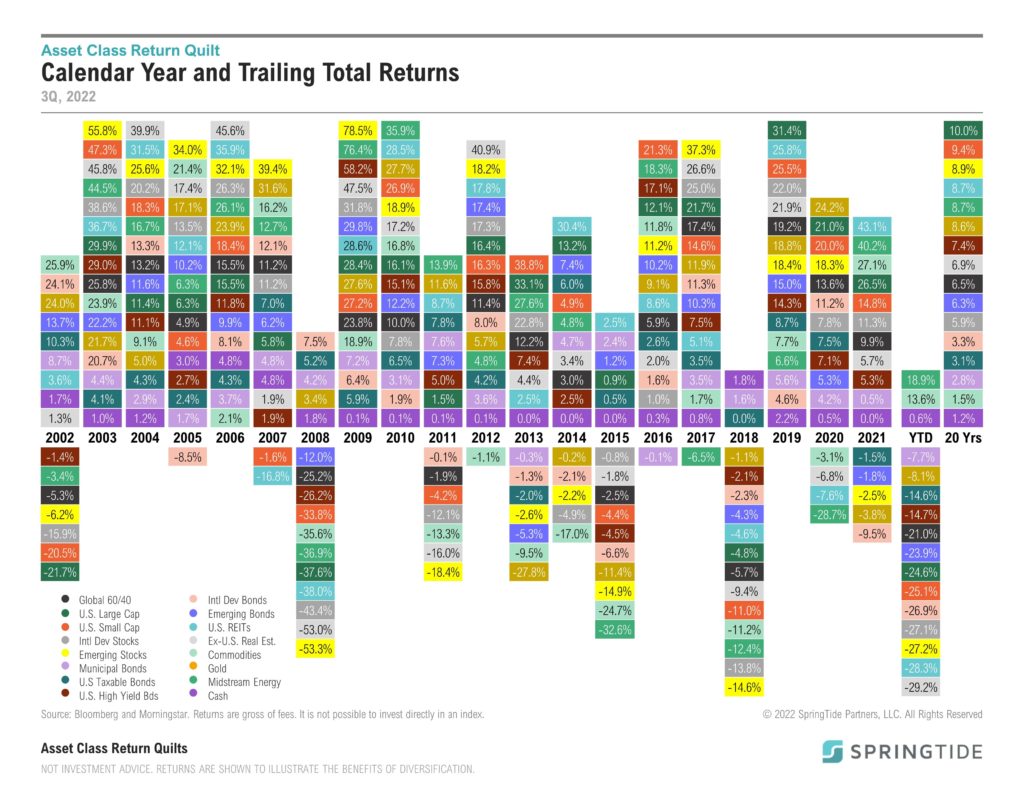
Gold and Taxable Bonds remained the best performing asset classes year to date. U.S. Large Cap Stocks continued to rally from the March 23 bear market lows, while U.S. Small Cap stocks lagged.
September 2022 Cartoon: Whac-a-Mole
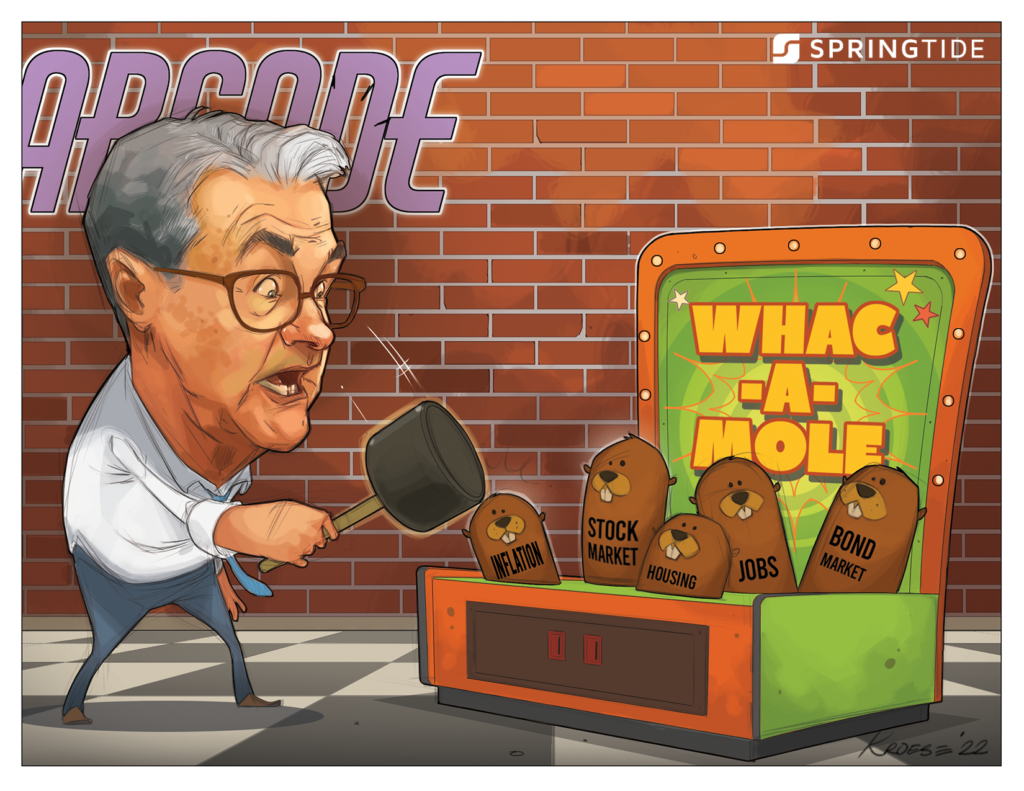
September 2022 Cartoon: Whac-a-Mole
COTW: U.S. Dollar vs Commodities
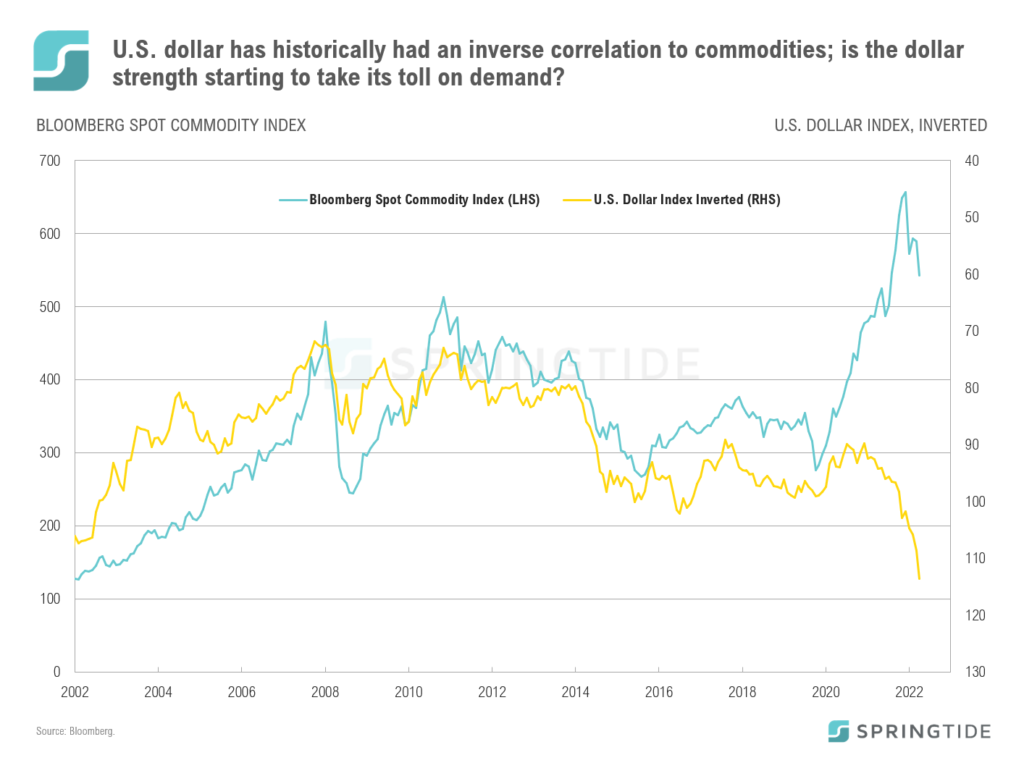
The U.S. dollar has historically had an inverse correlation to commodities. When the dollar strengthens, commodities become more expensive in non-U.S. currencies, which tends to lead to lower demand and thus lower prices. The inverse applies to dollar weakness.
August 2022 Commentary: Stalemate
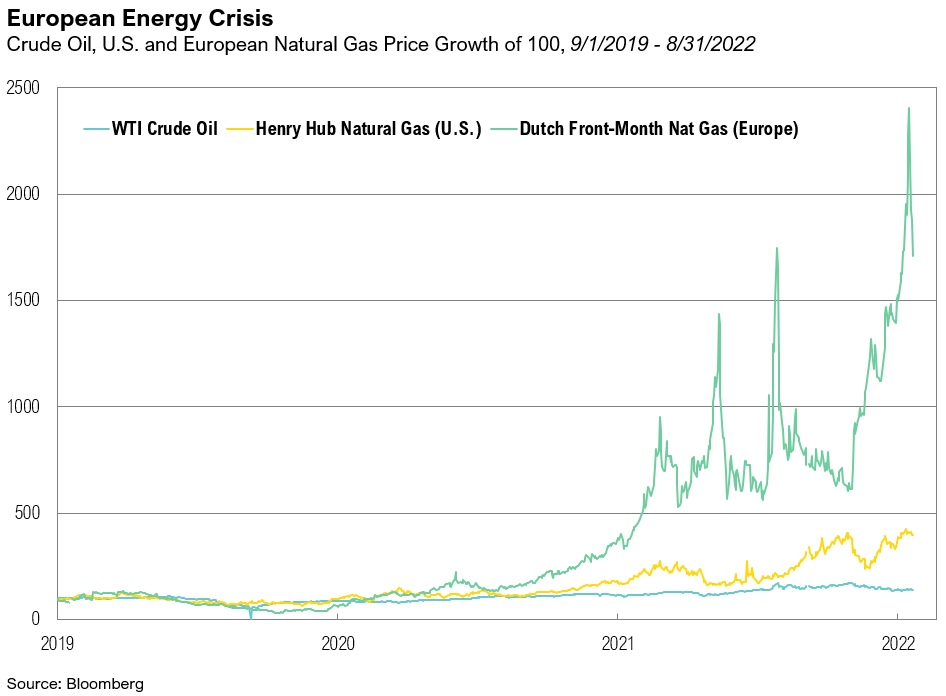
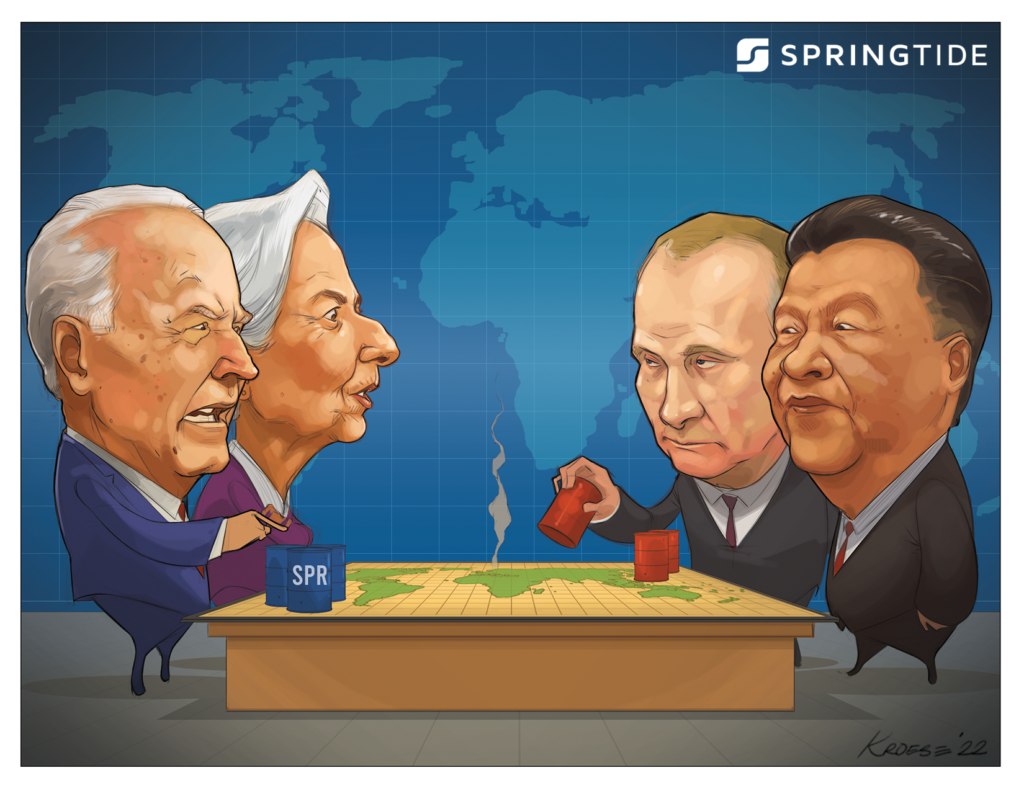
Terrible global conflict continues with Ukraine resolutely defending itself against Russia, Russia dealing with severe sanctions, and western Europe bracing for a winter marked by significantly limited gas and fuel supply, traditionally secured from Russia.
COTW: U.S. Stocks vs Bonds
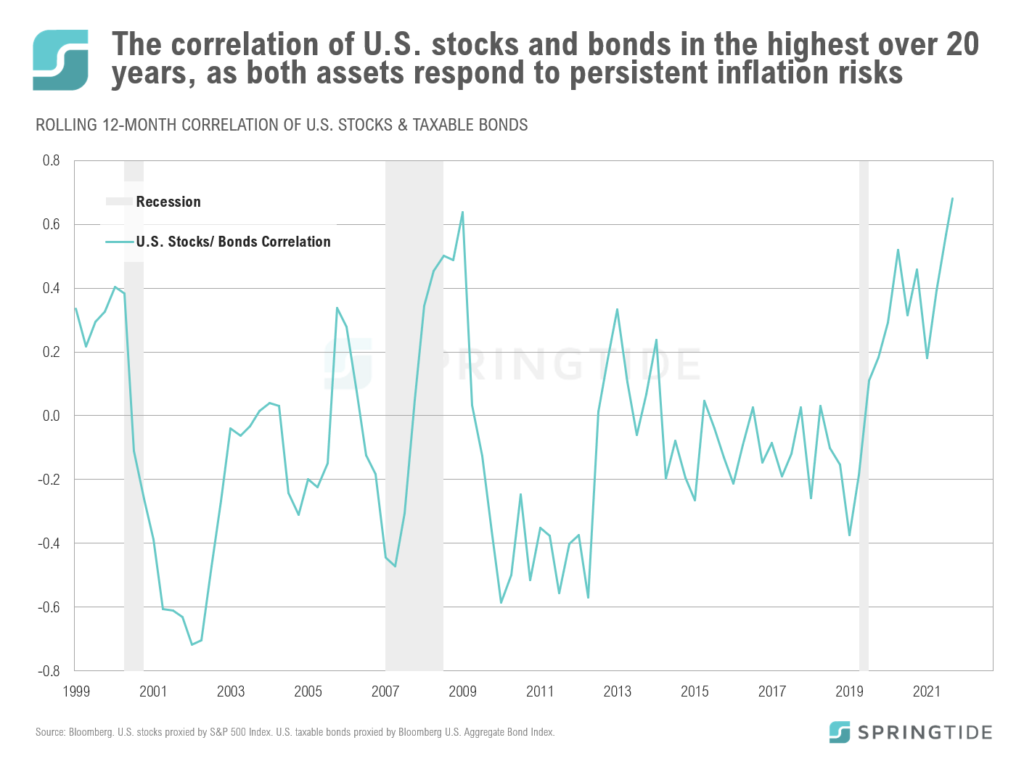
The average 1-year correlation between U.S. stocks and bonds has been negative since 2000, meaning that positive returns in the one asset class has generally been accompanied by negative returns in the other and vice-versa.
August 2022 Cartoon: Stalemate
August 2022 Cartoon: Stalemate
July 2022 Commentary: Domino Effect
Though second-quarter S&P 500 earnings were up overall, earnings are expected to decline 3.7% relative to the same quarter last year
Market Note: New Bull or Bear Market Rally
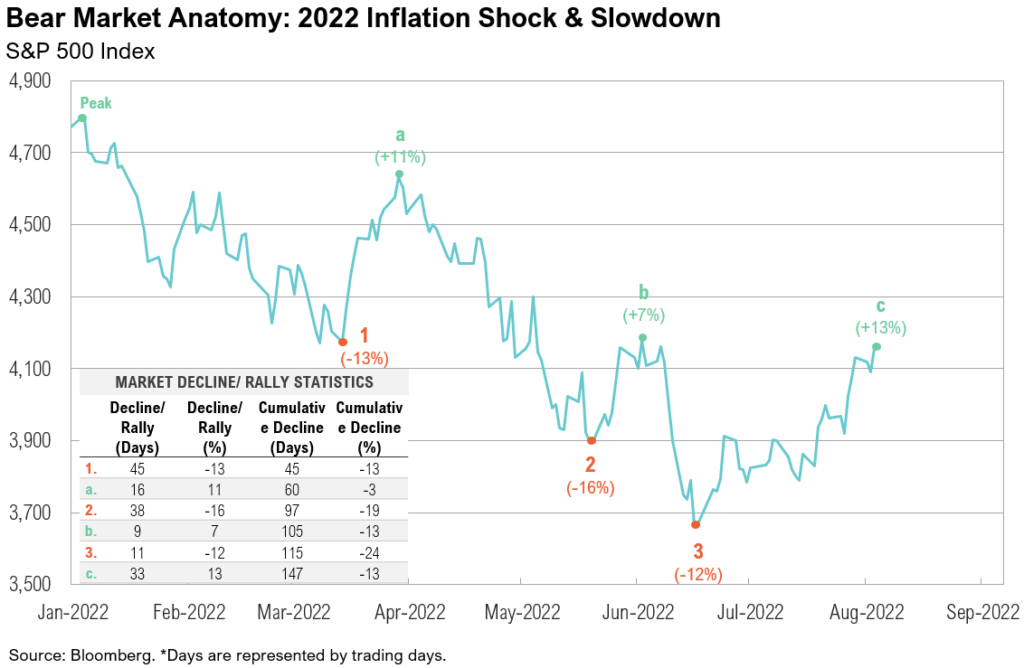
The “pain trade” rally we outlined in Market Scenarios & Risk Levels is well underway with Technology stocks and high yield bonds up 15.2% and 7.0%, respectively, since July 6.
COTW: Bear Market Rally
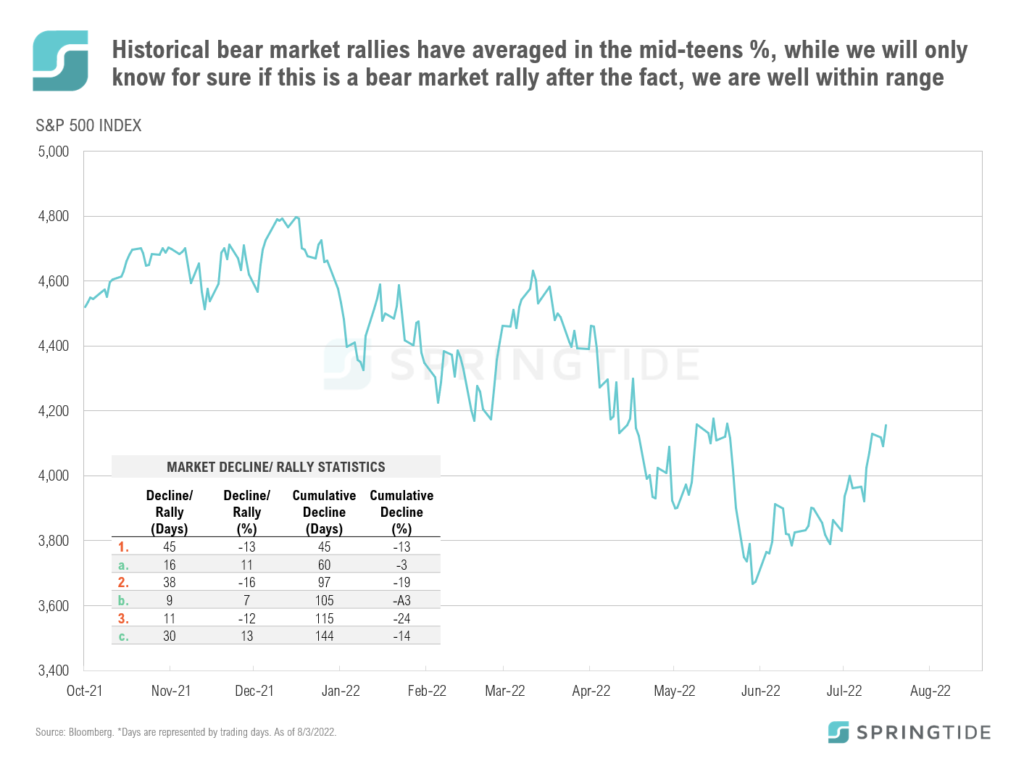
U.S. stocks, as proxied by the S&P 500, have rebounded from their June lows, rallying more than 13% in 33 days. While this rally has provided relief to the market, investor should be cautious in calling the end to the current bear market based on this rebound, as bear markets can experience multiple unsuccessful rallies before markets bottom.
July 2022 Cartoon: Domino Effect
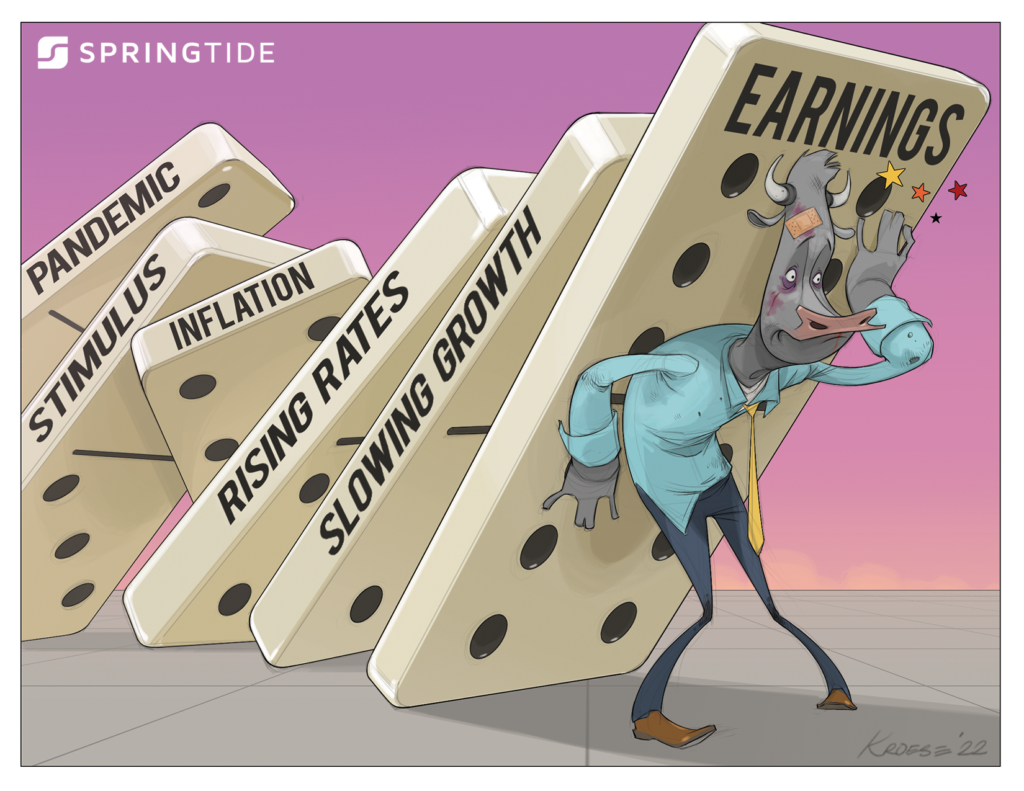
July 2022 Cartoon: Domino Effect
2Q 2022 Commentary: When Doves Cry
The past six months have been the worst start to a year for a traditional “60/40” portfolio since 1932 when the U.S. economy was in the Great Depression
Market Note: Market Scenarios and Risk Levels
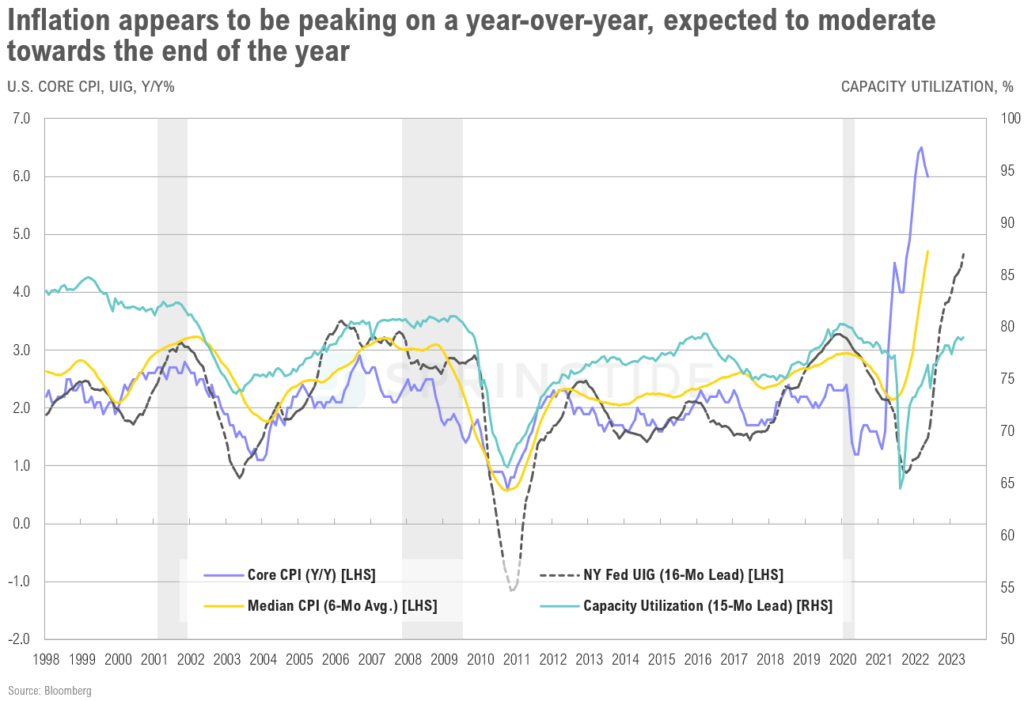
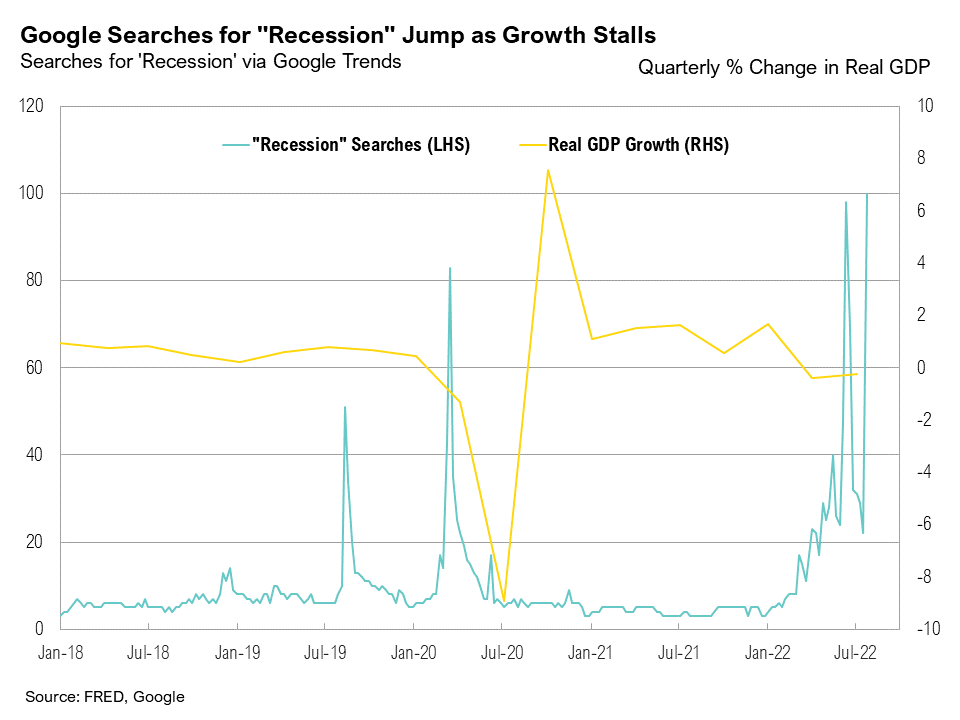
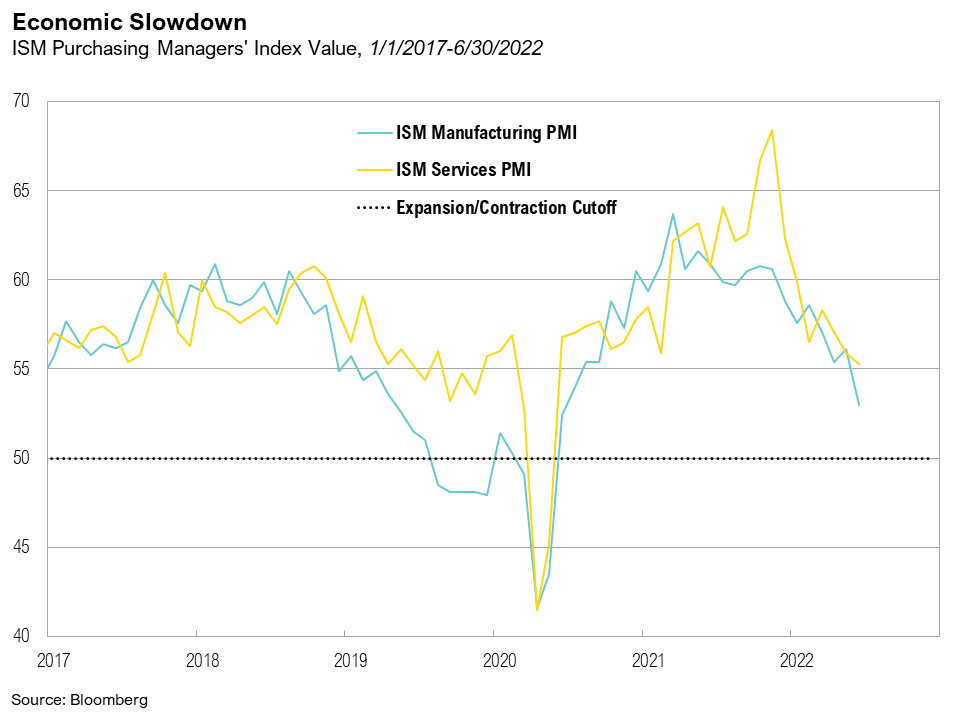
Recent economic data suggesting real GDP growth contracted in the second quarter has materially increased the potential for a recession this year.
June 2022 Cartoon: Hawkish Act

June 2022 Cartoon: Hawkish Act
2Q, 2022 Asset Class Return Quilts
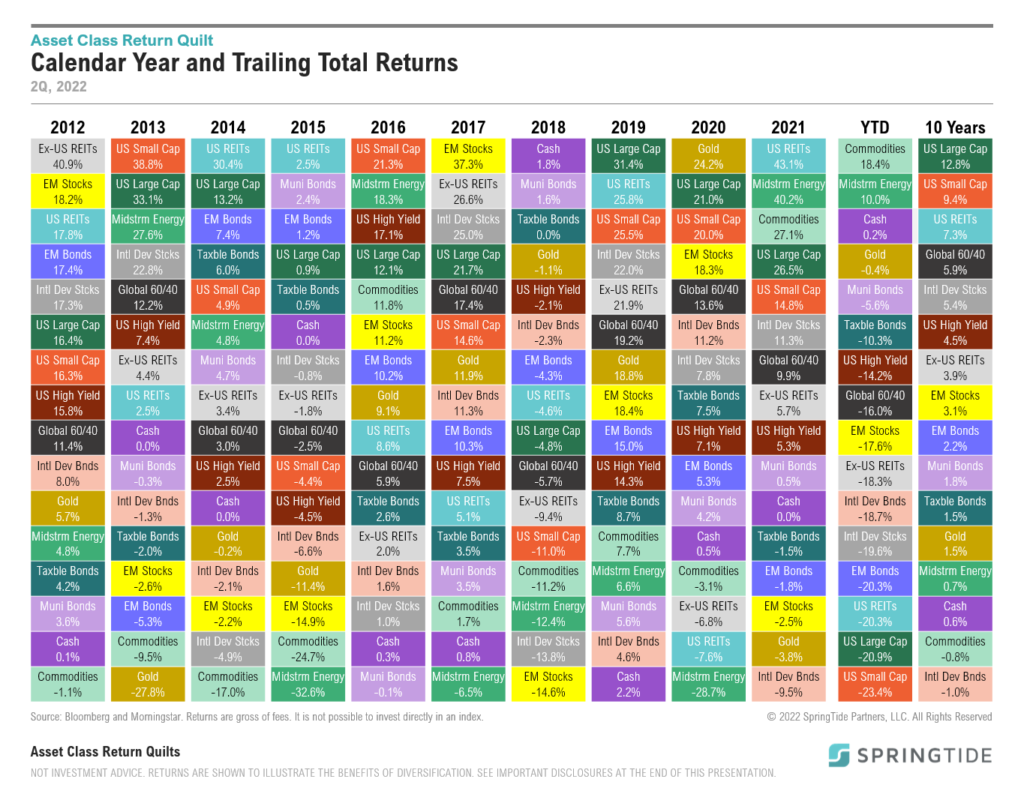
Commodities and energy stocks have so far served as the only two bright spots in the first half of 2022, up 18% and 32%, respectively.
May 2022 Cartoon: The Squeeze
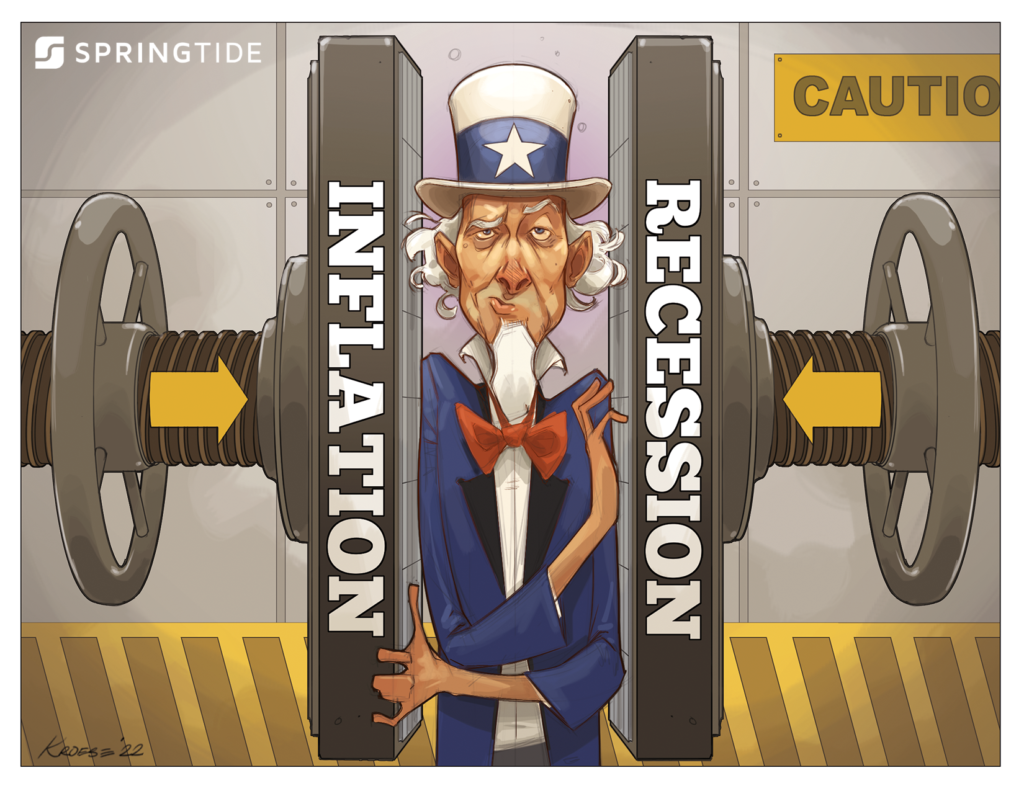
May 2022 Cartoon: The Squeeze
May 2022 Commentary: Goldilocks and the Two Bearish Scenarios
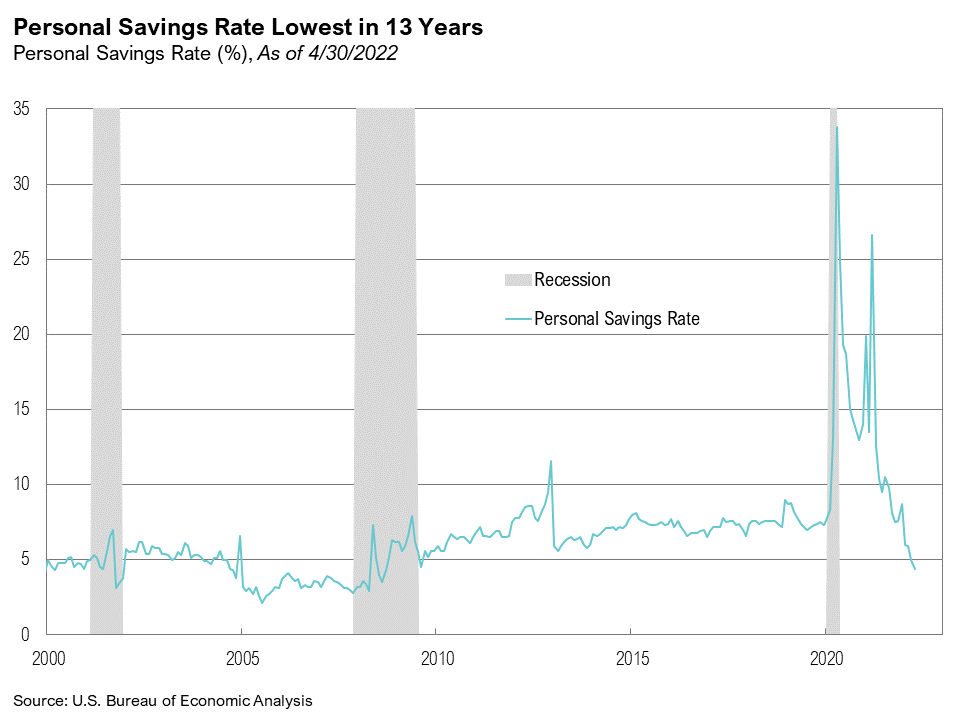
Equity markets remained volatile in May as a late-month rally erased losses, pushing most indexes to slight gains for the month
April 2022 Commentary: The Tipping Point
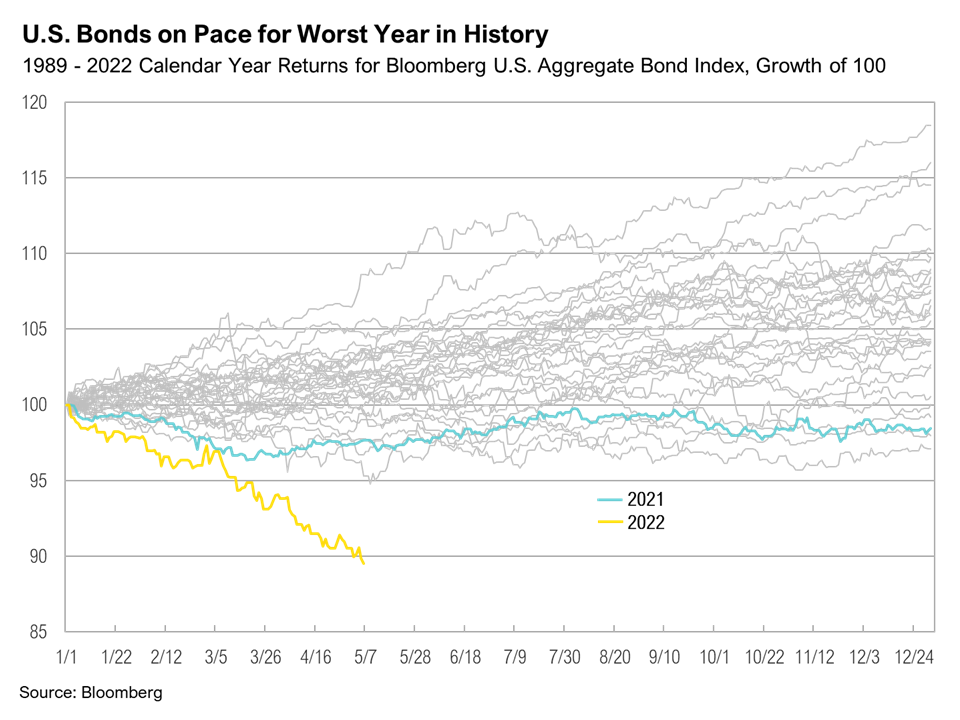
Global markets have been roiled by a succession of blows in April – higher bond yields, lingering post-pandemic supply chain imbalances, a commodity price shock exaggerated by the war in Ukraine, and lockdowns across most major cities in China
1Q 2022 Commentary: A Nickel for Your Thoughts
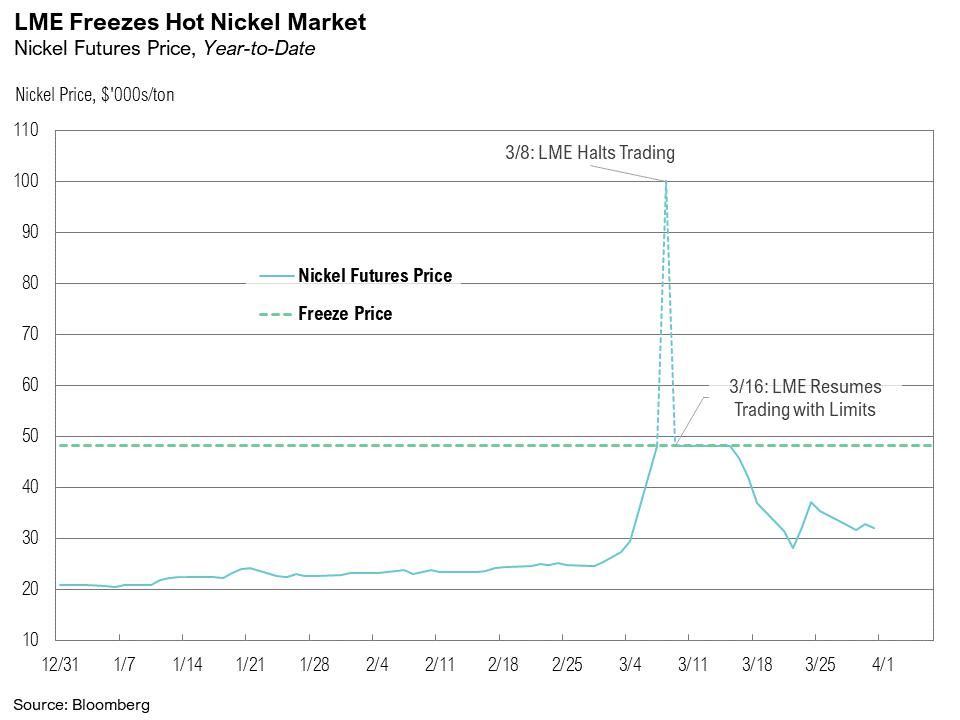
For the second time in two years, the global economy was thrust into a crisis, first from a pandemic and then from Russia’s invasion of Ukraine
March 2022 Cartoon: A Nickel for Your Thoughts
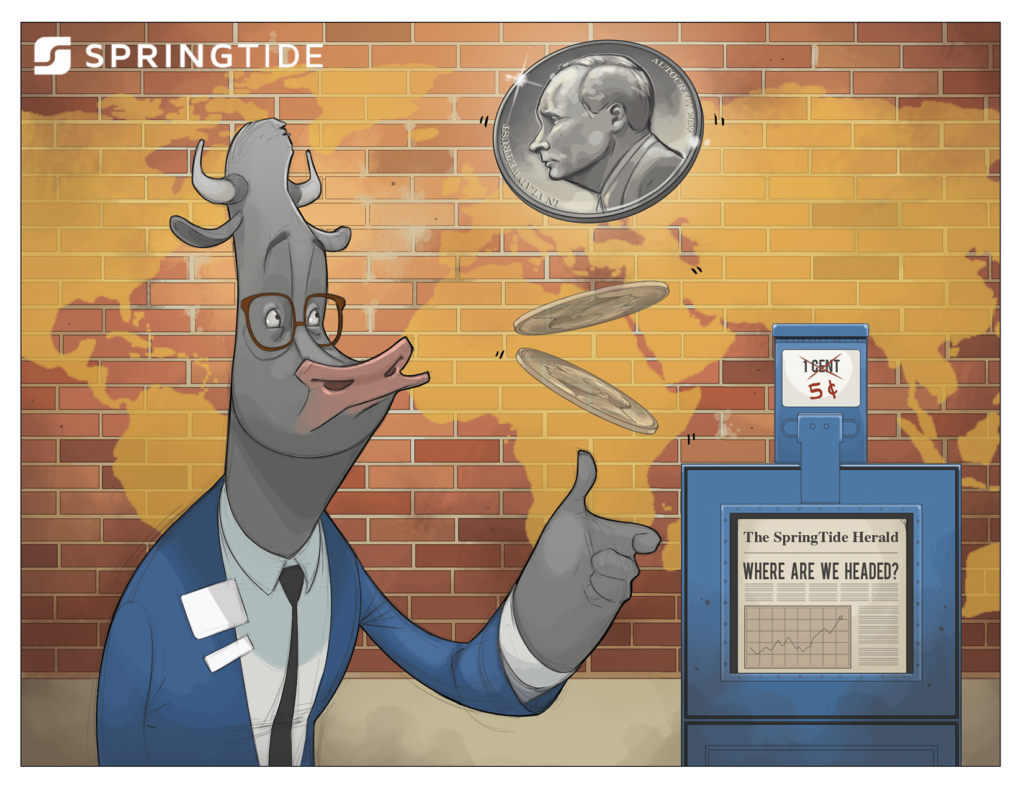
March 2022 Cartoon: A Nickel for Your Thoughts
1Q, 2022 Asset Class Return Quilts
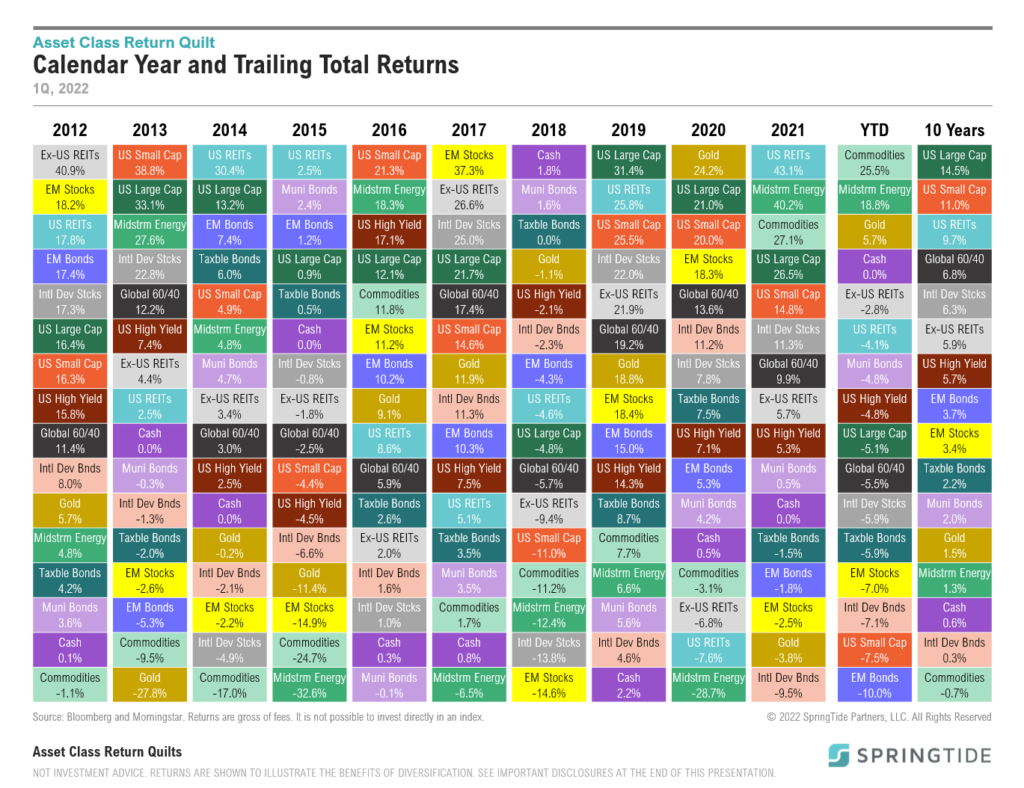
For the second time in two years, the global economy has been thrust into a crisis – first from the pandemic, and now from Russia’s invasion of Ukraine.
January 2022 Commentary: Behind the Curve
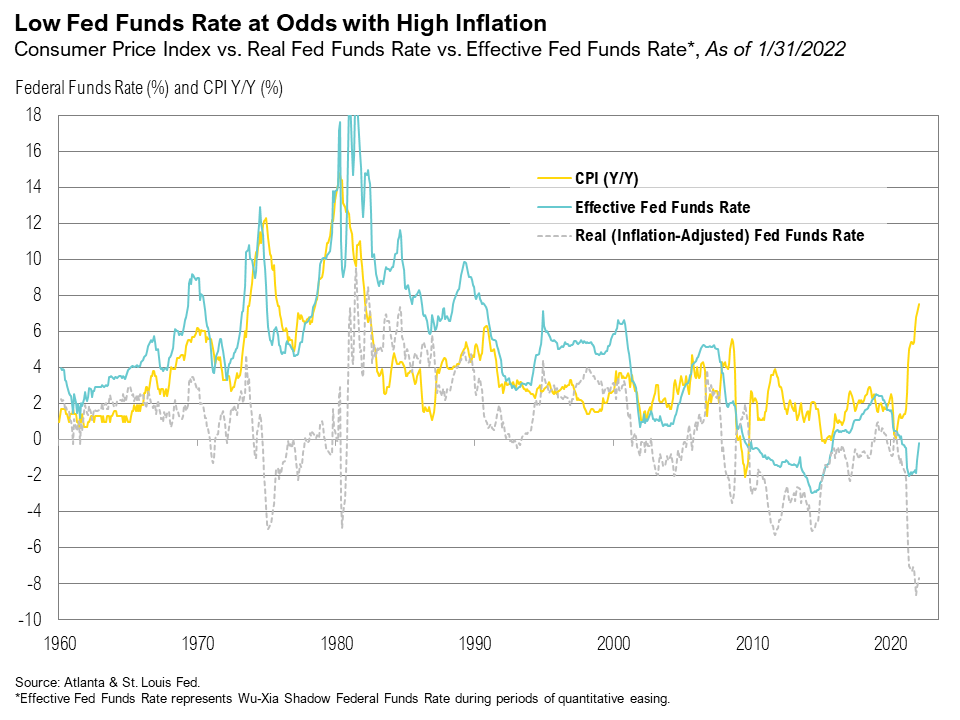
Volatility rose in January, and stocks dipped into correction territory as stubbornly high inflation raised the prospects for an accelerated Fed hiking cycle
Q4 2021 Commentary: Candyland
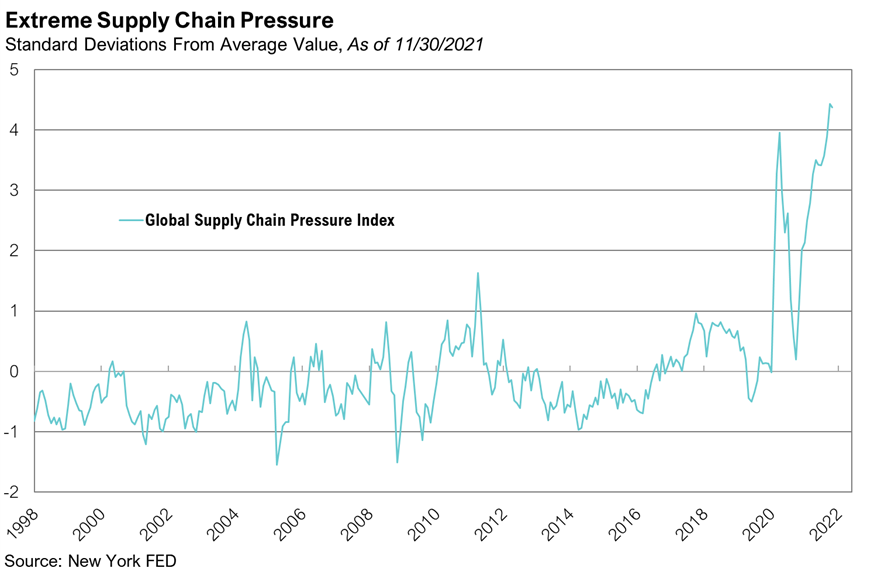
Equity markets delivered positive returns in the final quarter while fixed income returns were flat.
December 2021 Cartoon: Candyland
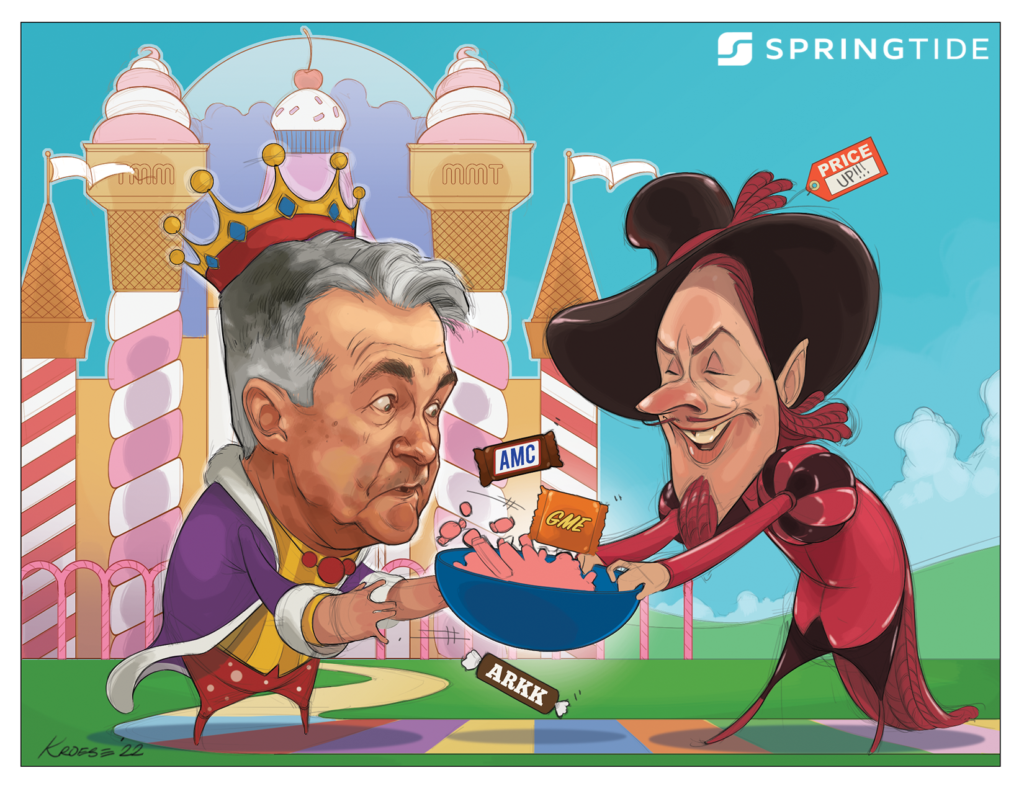
December 2021 Cartoon: Candyland
November 2021 Commentary: Coming to Grips with Persistent Inflation
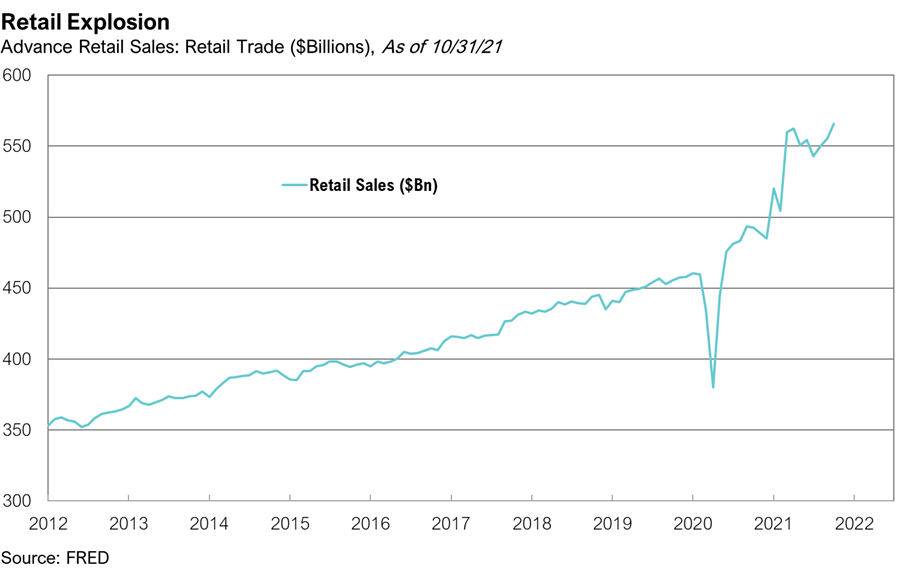
Following its best month of the year, the S&P 500 Index cooled off in November, falling 0.7%.
November 2021 Cartoon: Santa Needs Help
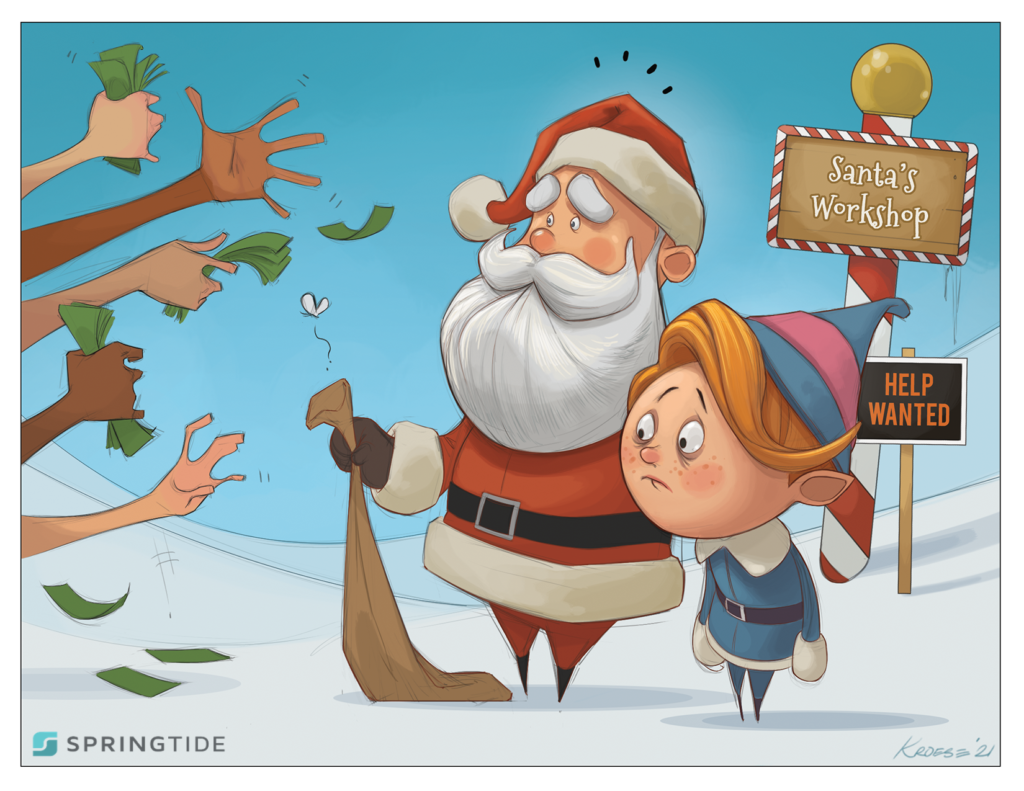
November 2021 Cartoon: Santa Needs Help
October 2021 Commentary: Heating Up
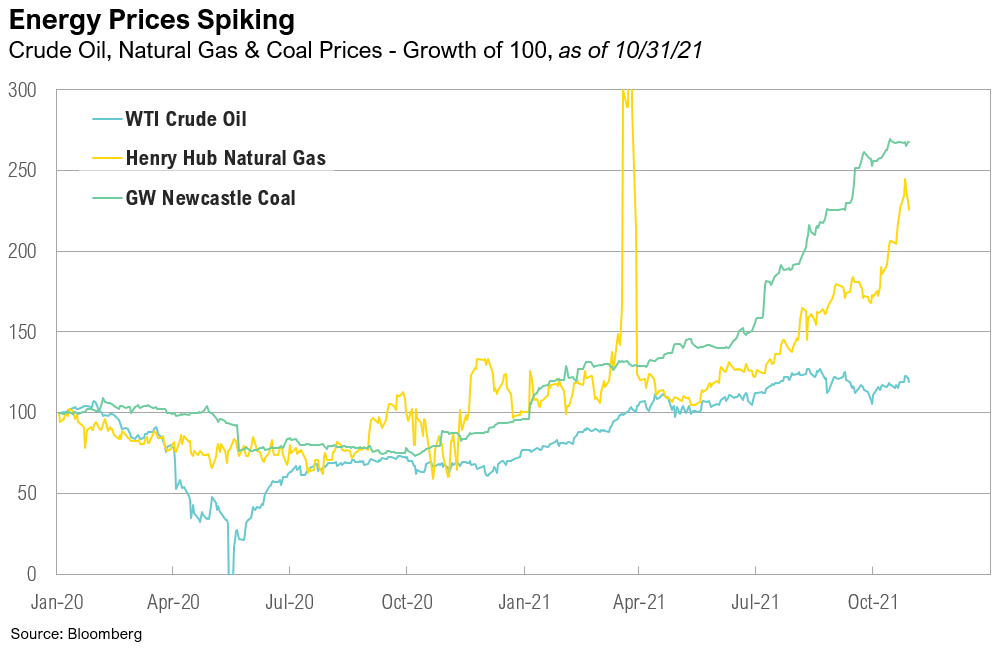
The S&P 500 Index had its best month of the year in October, rising 7% and bouncing back from September’s 4.7% loss, its worst month since March 2020.
September 2021 Cartoon: Where are the Bond Vigilantes
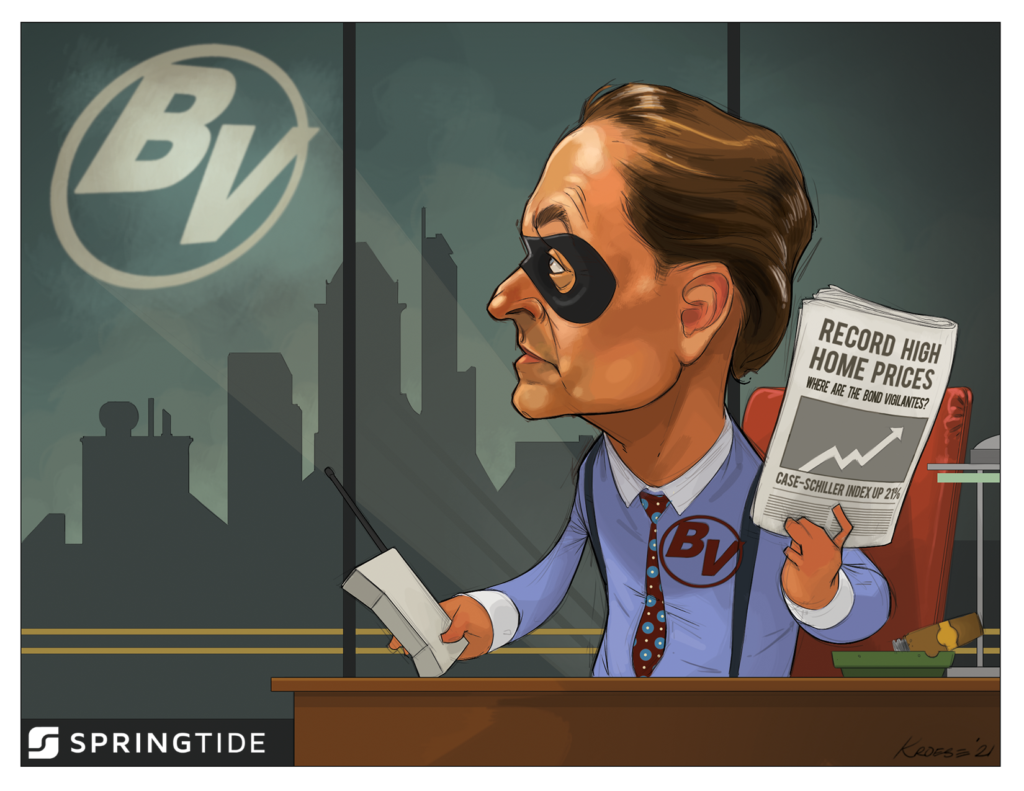
September 2021 Cartoon: Where are the Bond Vigilantes
3Q 2021 Commentary: Bond Vigilantes
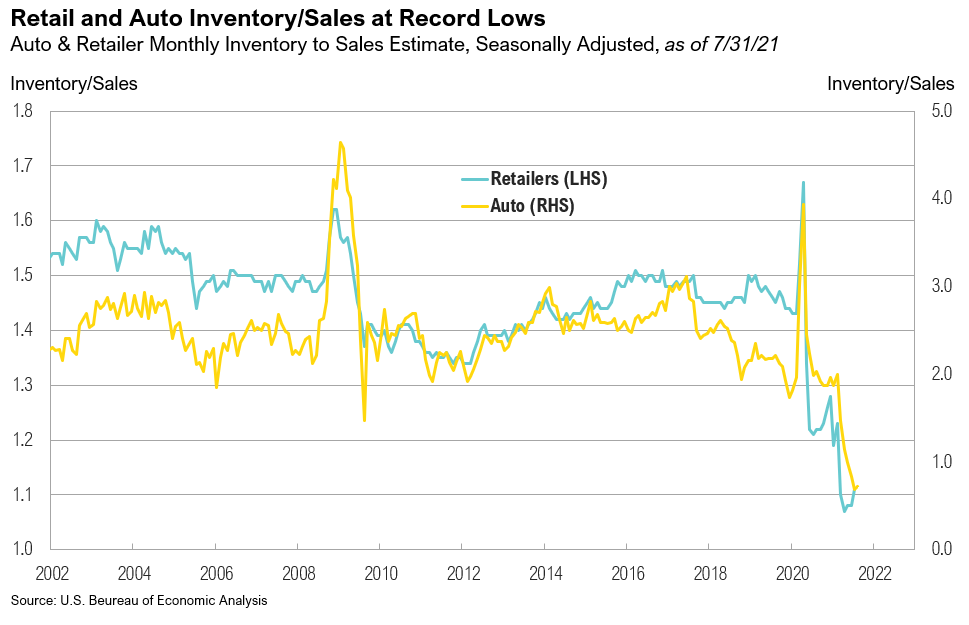
Markets delivered bland returns during the third quarter—a welcome development considering the stellar returns achieved earlier in the year.
August 2021 Commentary: Under the Surface
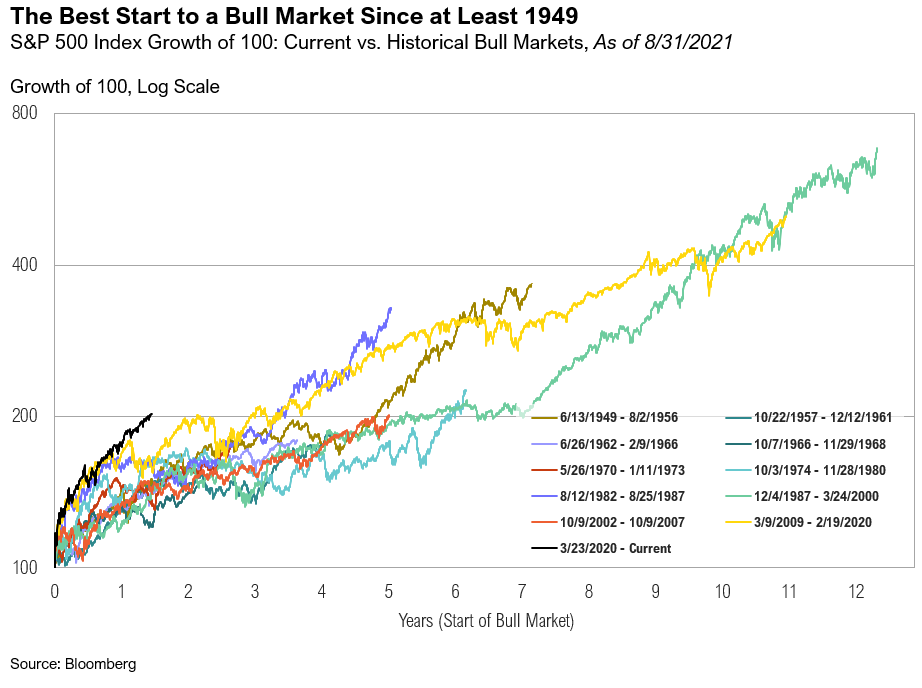
The U.S. stock market rallied for the seventh consecutive month in August, adding to an unusually impressive – and calm – year for risky assets.
July 2021 Commentary: Crypto, Corporate Earnings, and Covid
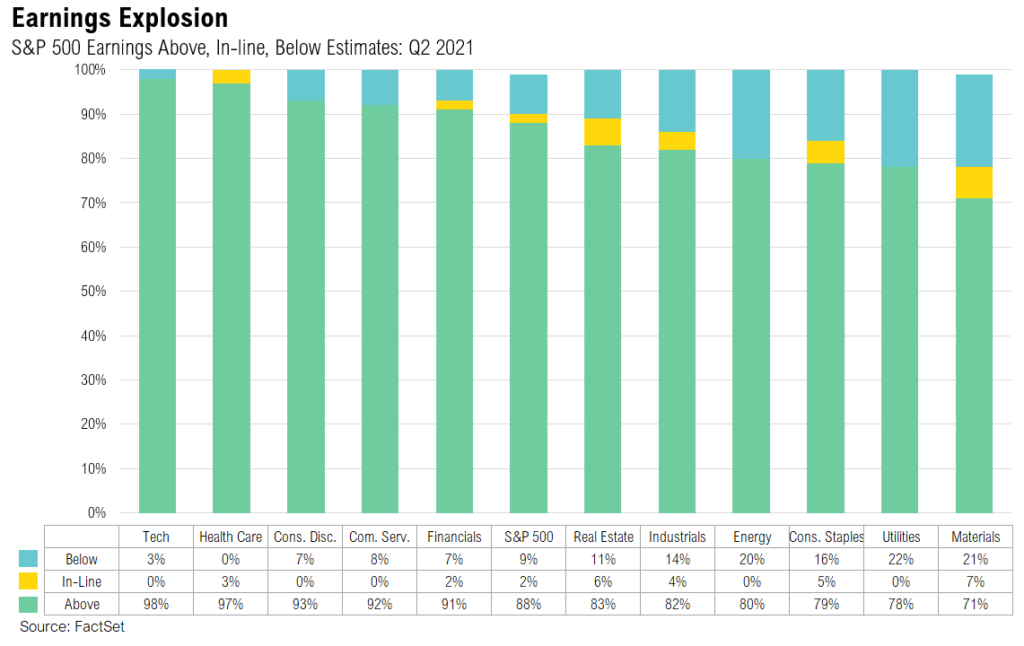
During July, fears of impending inflation declined, sparking a positive response in yield-sensitive assets and mixed results in other markets.
2Q 2021 Commentary: Taking Stock
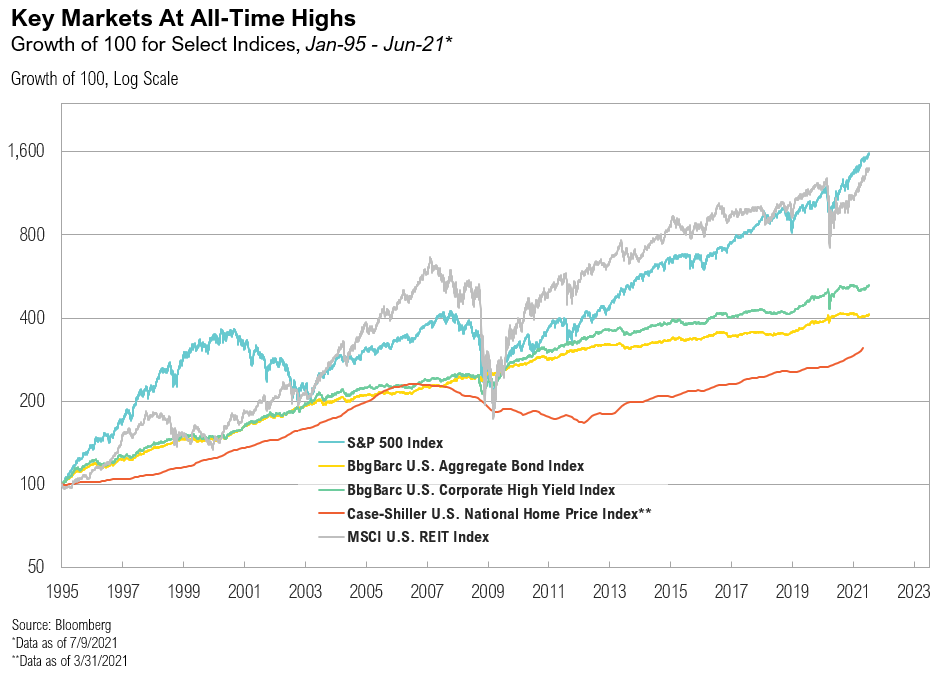
Most asset prices rose during the quarter amidst continued economic reopening and extraordinary levels of policy accommodation.
2Q, 2021 Asset Class Return Quilts
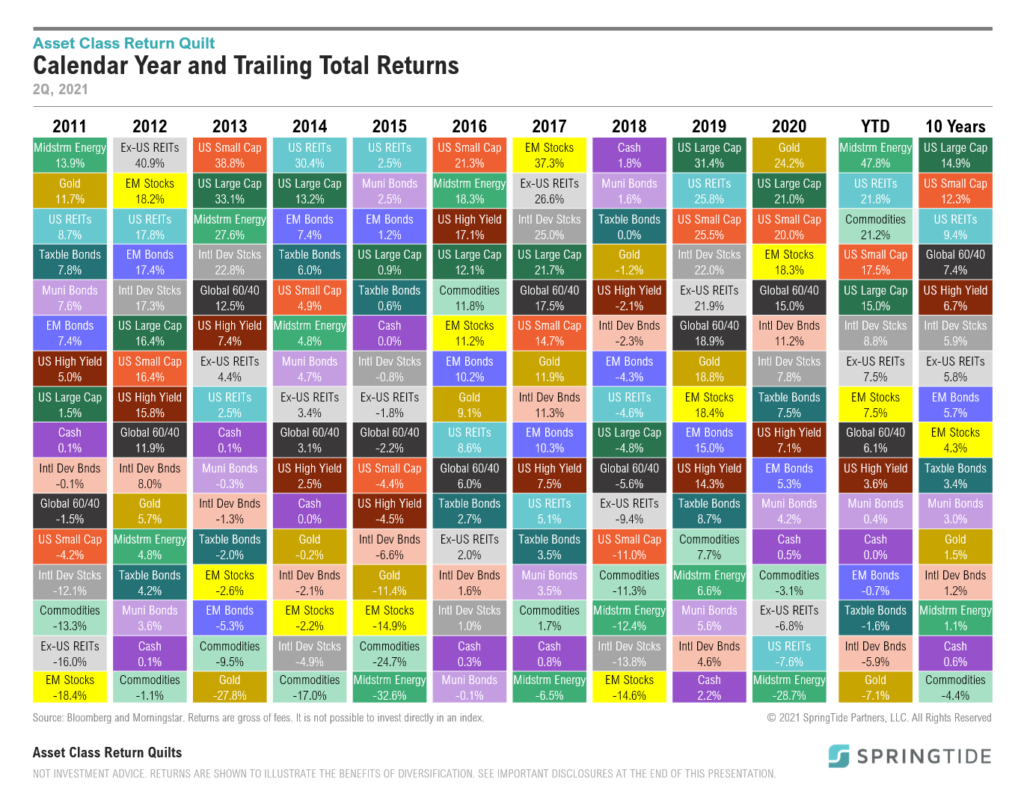
Midstream energy ended the year as the top-performing asset class, returning 30.9%.
June 2021 Cartoon: Inflation, Then vs. Now

June 2021 Cartoon: Inflation, Then vs. Now
Market Note: The Inflation Watershed
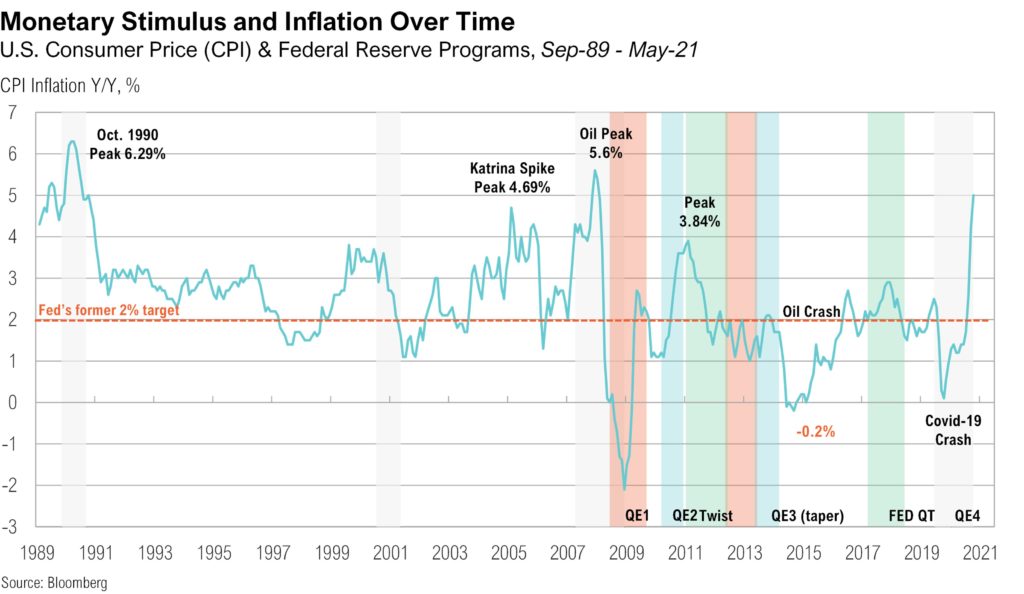
For over a decade, the Fed has struggled to hit its internal inflation target despite responding to every episode of economic weakness with increasingly extreme and experimental monetary policy, including 0% interest rates and widescale asset purchases.
May 2021 Commentary: Help Wanted
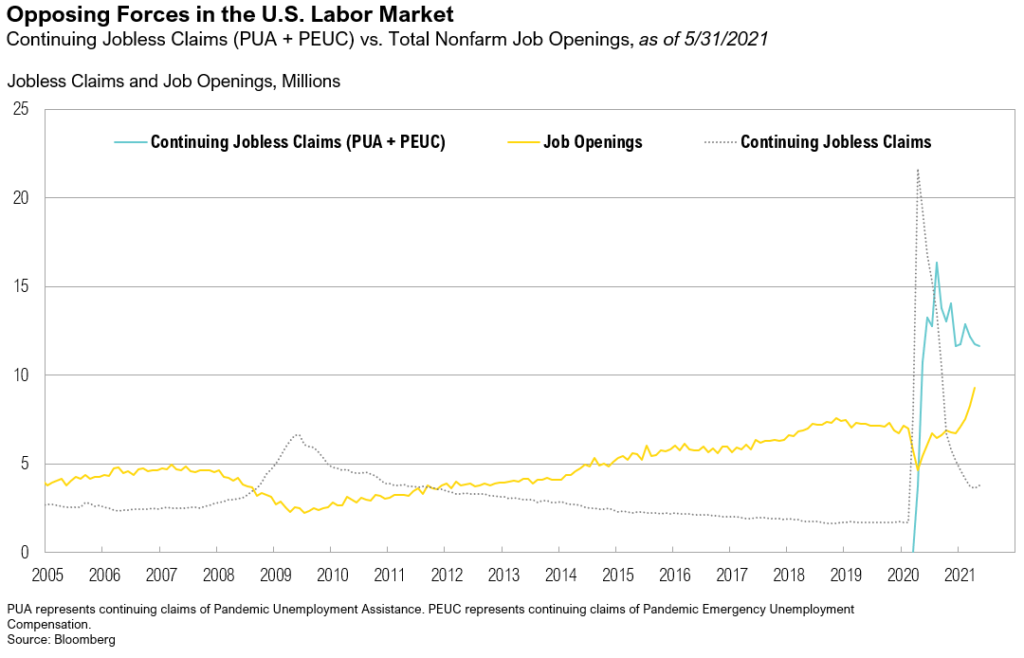
Real assets were the top performers for the month of May due to the continued reopening of the U.S. economy and historic levels of stimulus from Washington
April 2021 Commentary: Happy Anniversary, Inflation!
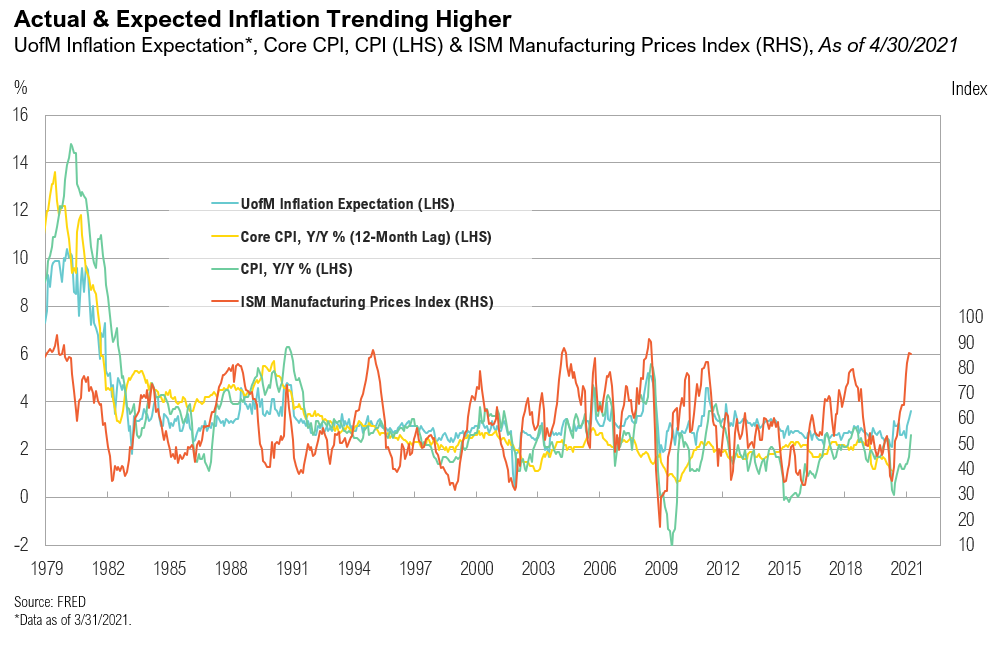
All asset classes rose for the month, and most have generated year-to-date returns that would be considered attractive for an entire year.
1Q 2021 Commentary: Throw the Confetti
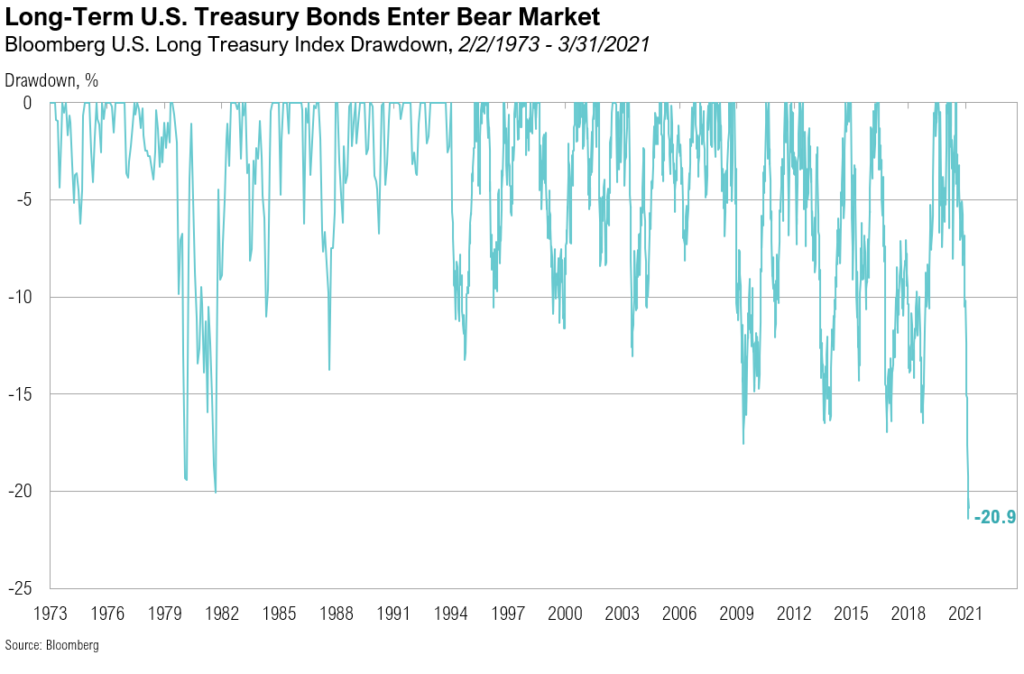
At the end of the quarter, investors enjoyed the robust returns of riskier asset classes and policymakers’ continued commitment to extraordinary accommodation.
1Q, 2021 Asset Class Return Quilts
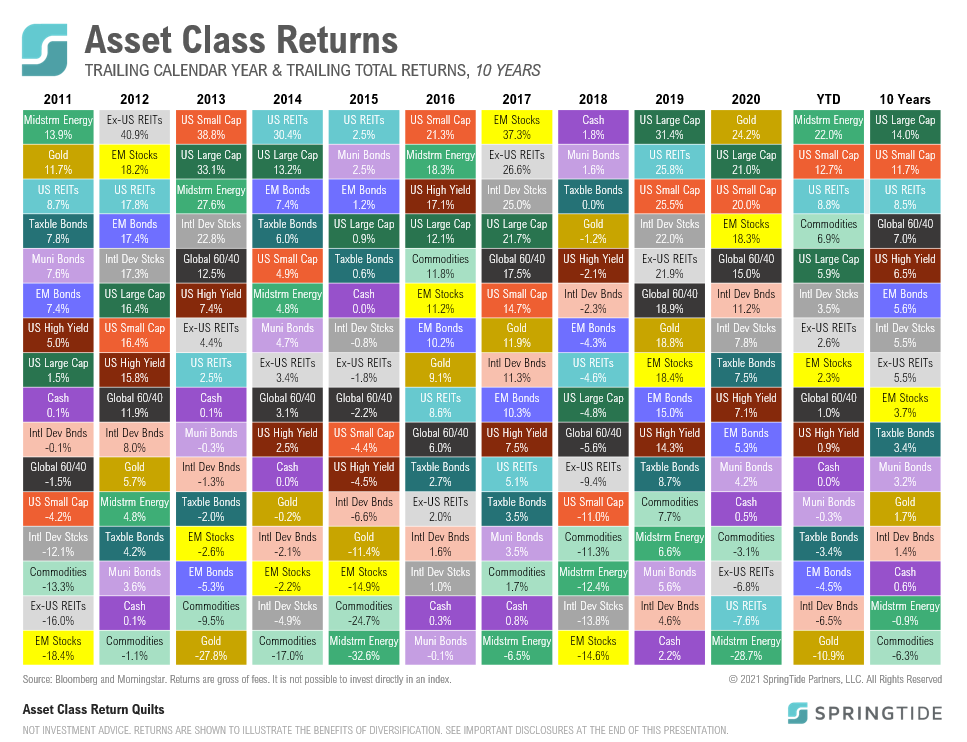
Midstream energy ended the year as the top-performing asset class, returning 30.9%.
March 2021 Cartoon: Throw the Confetti

March 2021 Cartoon: Throw the Confetti
December 2020 Cartoon: Try Not to Suck, 2021
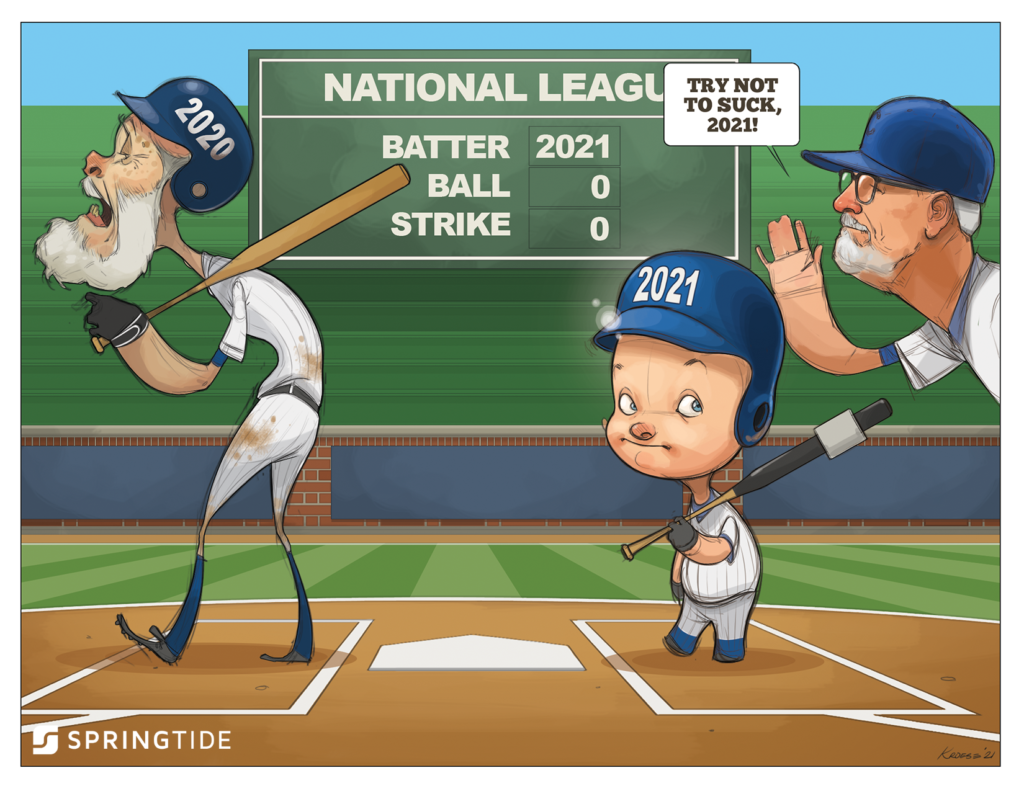
December 2020 Cartoon: Try Not to Suck, 2021
COTW: IPOs Have Left Many Speechless This Year
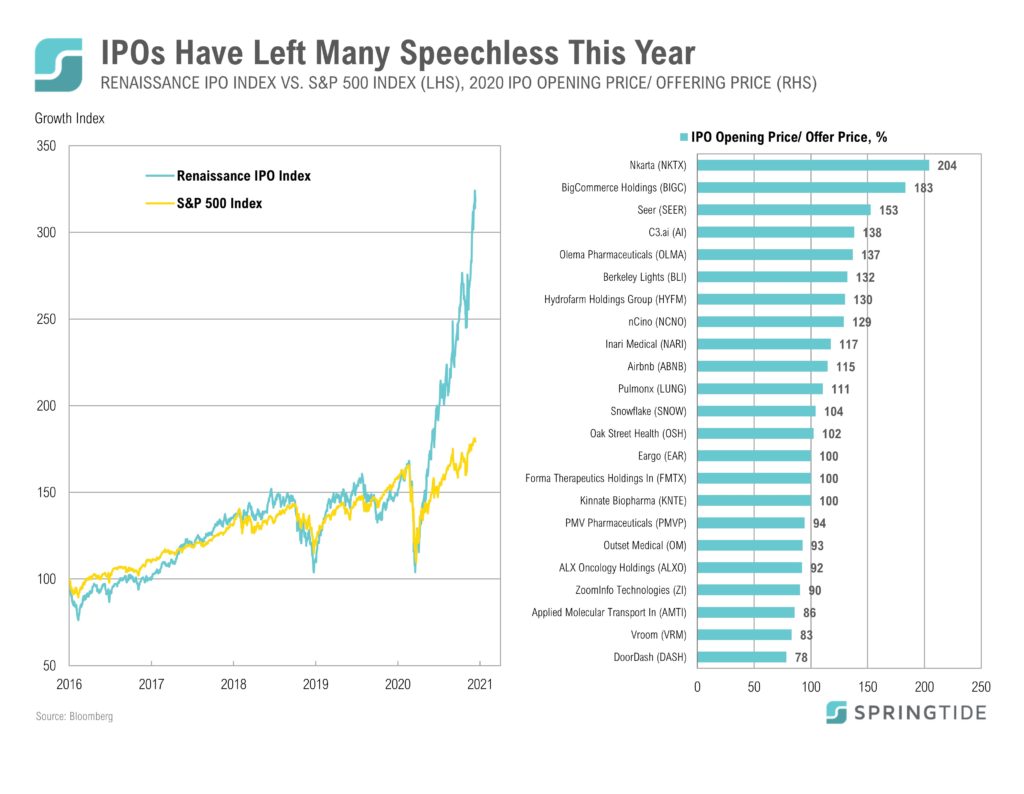
Airbnb CEO and Co-Founder, Brian Chesky, was left speechless on Bloomberg TV last week after hearing the opening price of his company’s IPO for the first time. It was a reaction shared by many investors this year when observing the performance of IPOs.
COTW: Small Cap Stocks Playing Catch-up
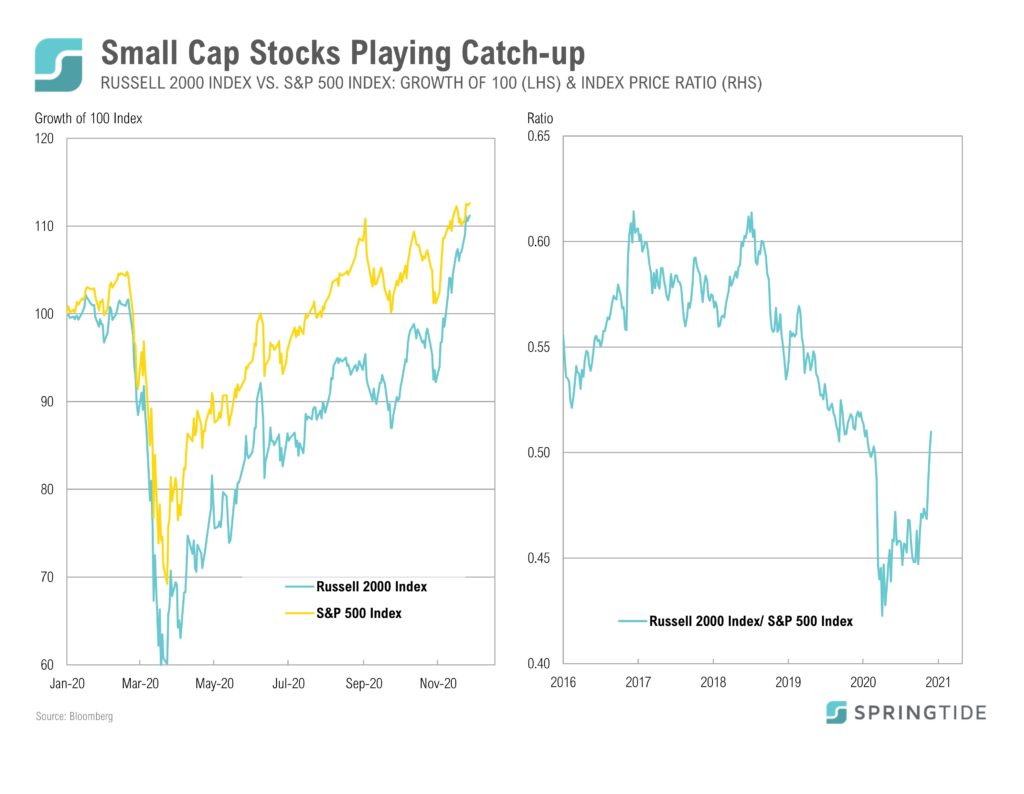
While small cap stocks (as measured by the Russell 2000 Index) have lagged large cap stocks (as measured by the S&P 500 Index) year to date, the gap narrowed in November after small cap outperformed large cap by 9.3% (as of November 29).
COTW: Here We Go Again
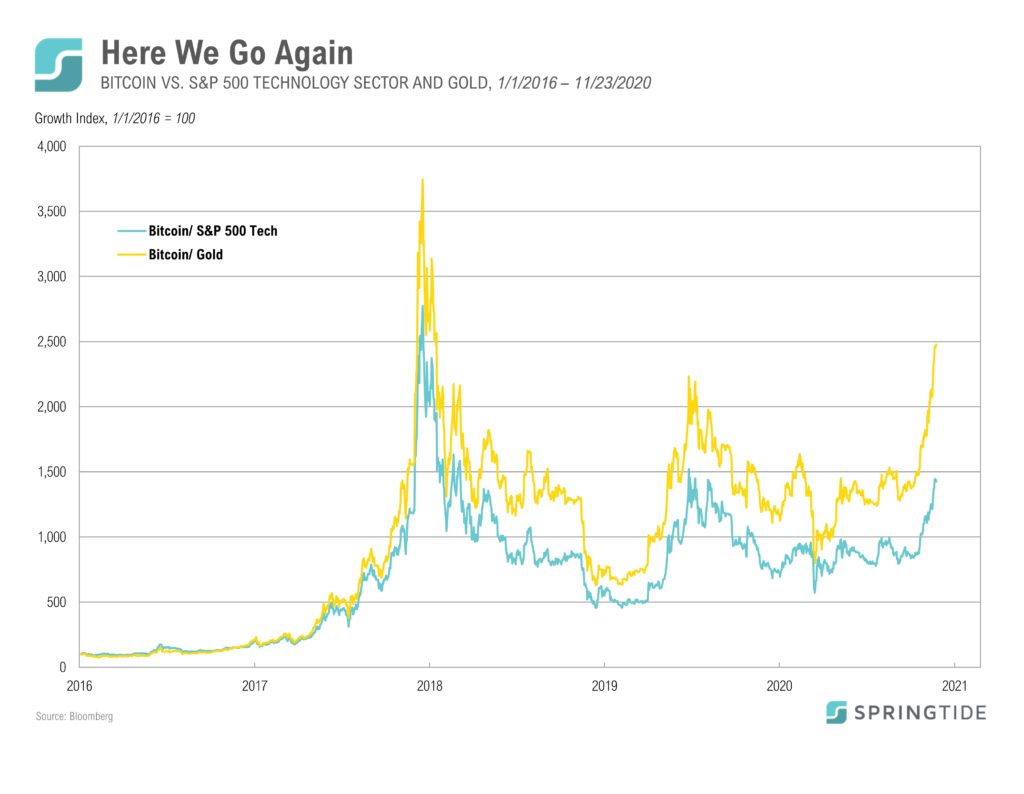
Reminiscent of late 2017-early 2018, risk assets are rallying into year end and bitcoin is leading the charge as it nears its December 17, 2017 high of $19,041.
COTW: Gridlock vs. Sweep
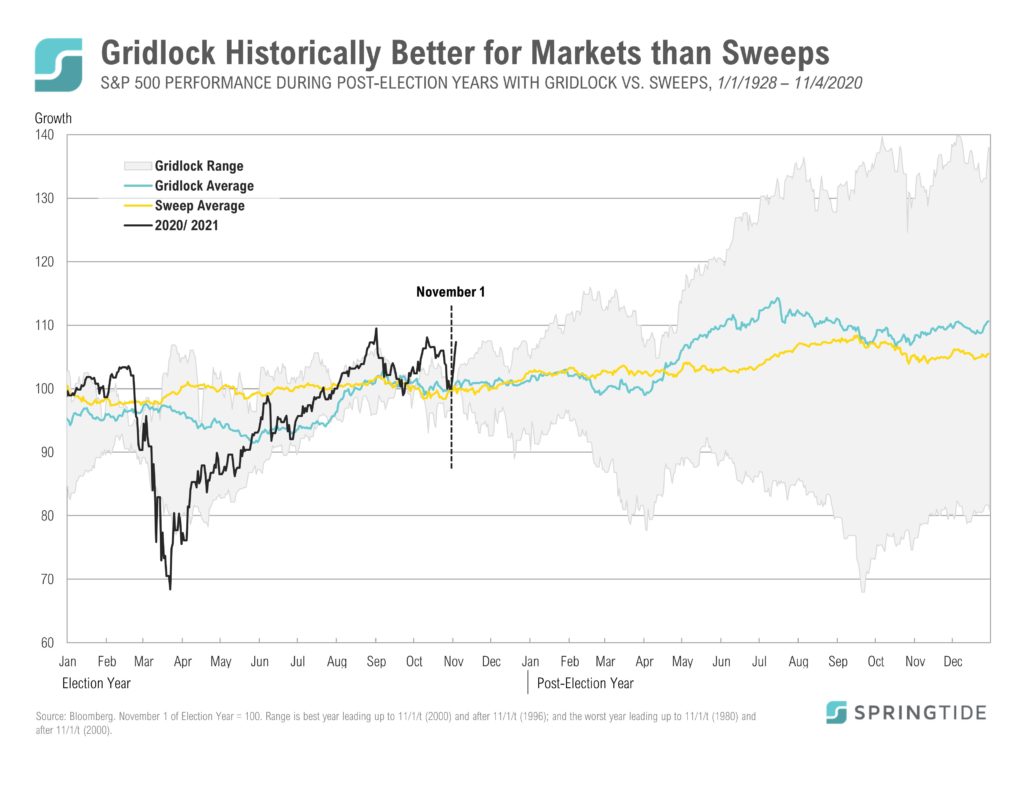
Heading into the 2020 election, the most probable outcome according to betting markets…
COTW: International Investors Crowd into U.S. Stocks
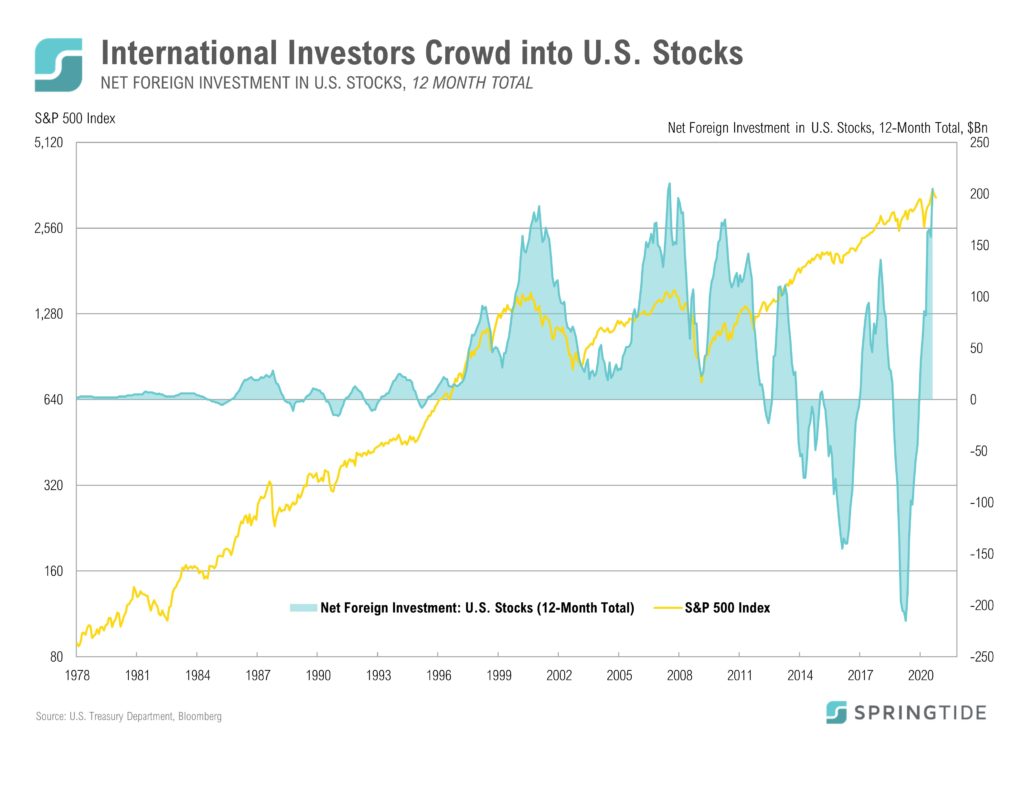
Last month, the U.S. Treasury Department released its Treasury International Capital (TIC) data for August which showed…
COTW: Single-Family Housing Starts Hit a 13-Year High
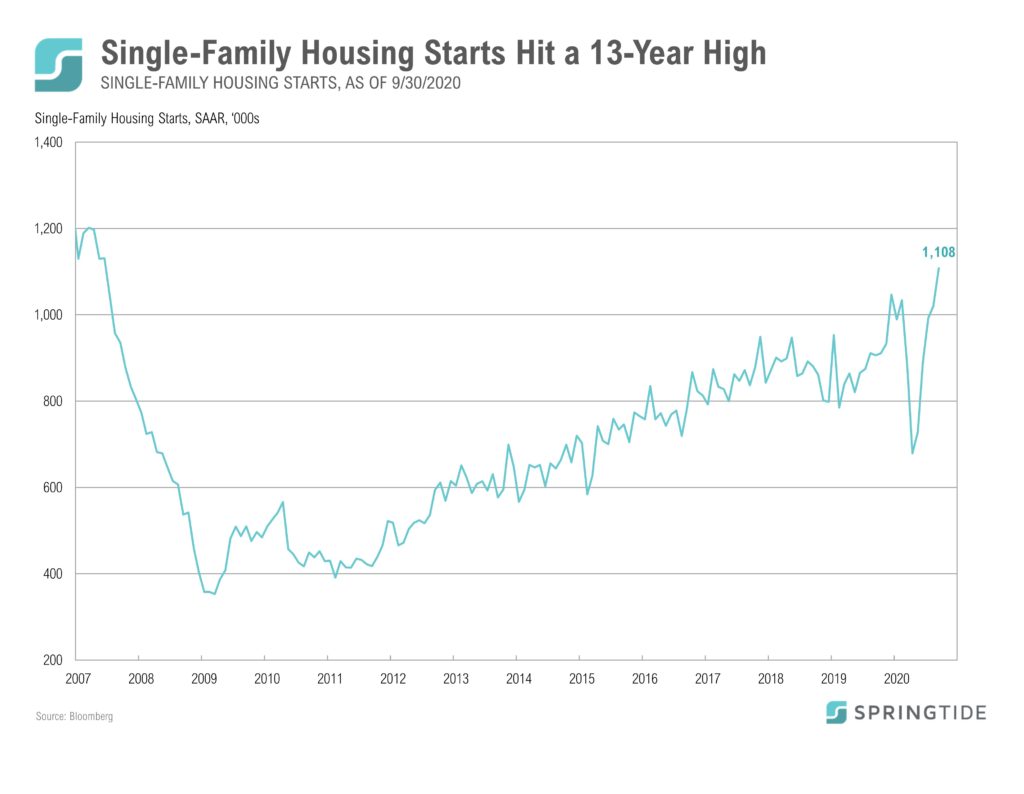
Last week, the U.S. Census Bureau and the U.S. Department of Housing and Urban Development…
COTW: Smaller Companies Continue to Lag Market Recovery
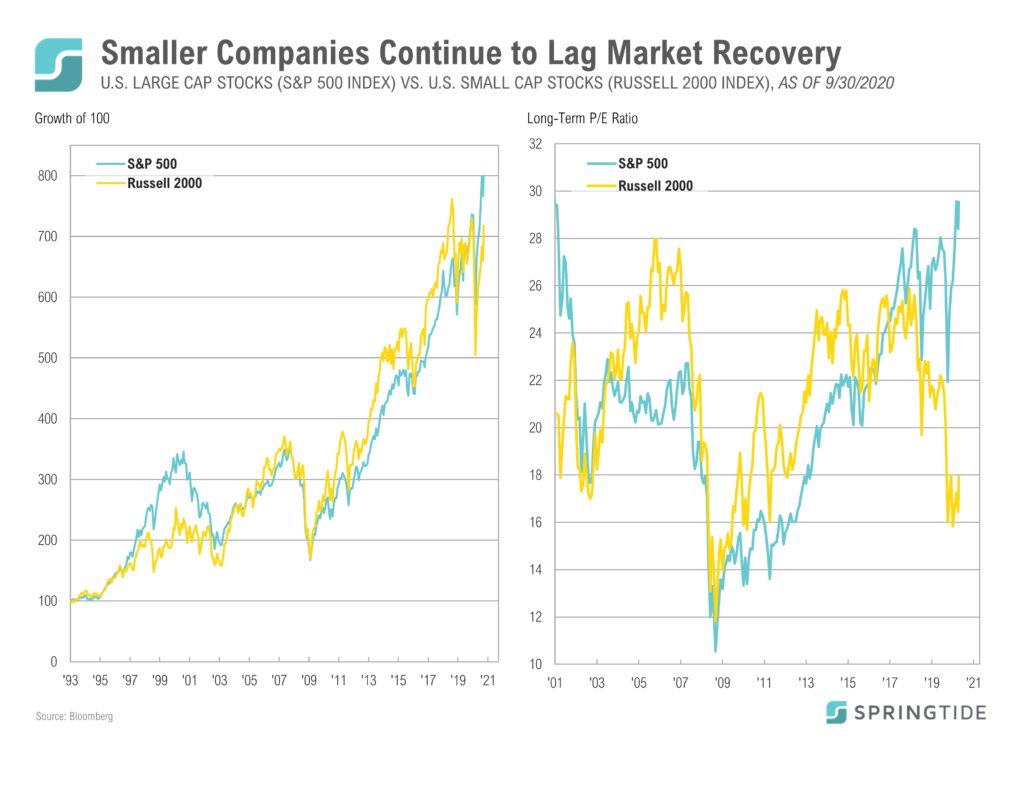
Last week, the U.S. Census Bureau and the U.S. Department of Housing and Urban Development…
September 2020 Cartoon: Caught in the Middle
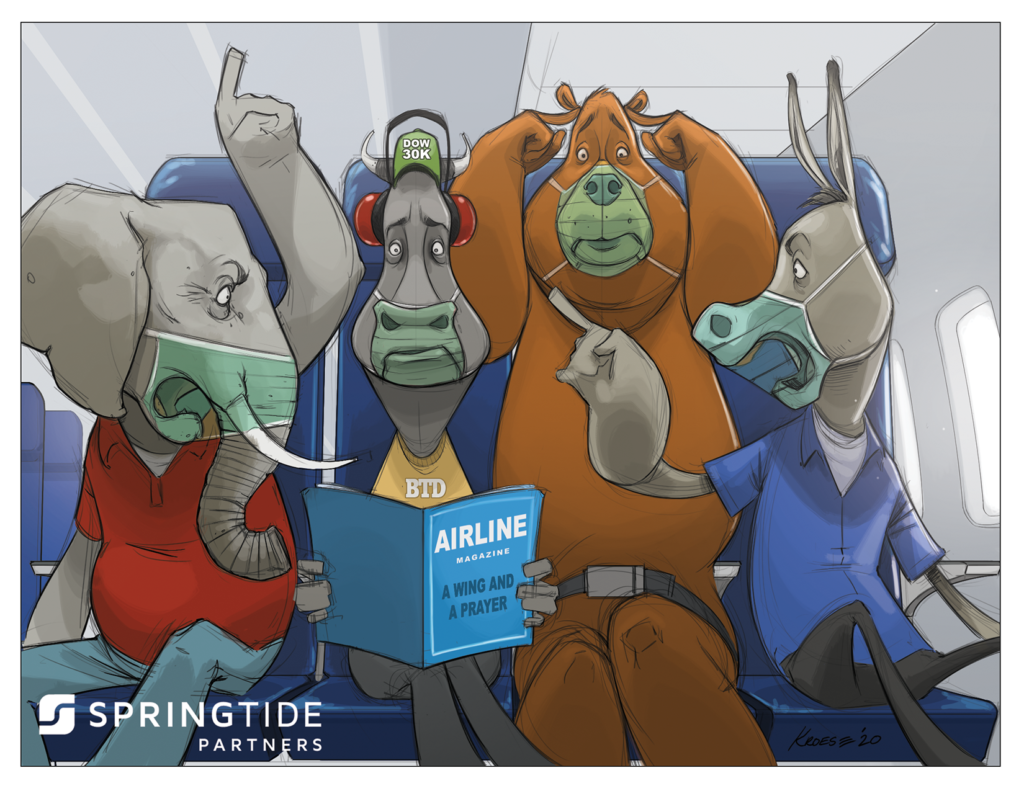
September 2020 Cartoon: Caught in the Middle
COTW: Labor Market Recovery is Slowing
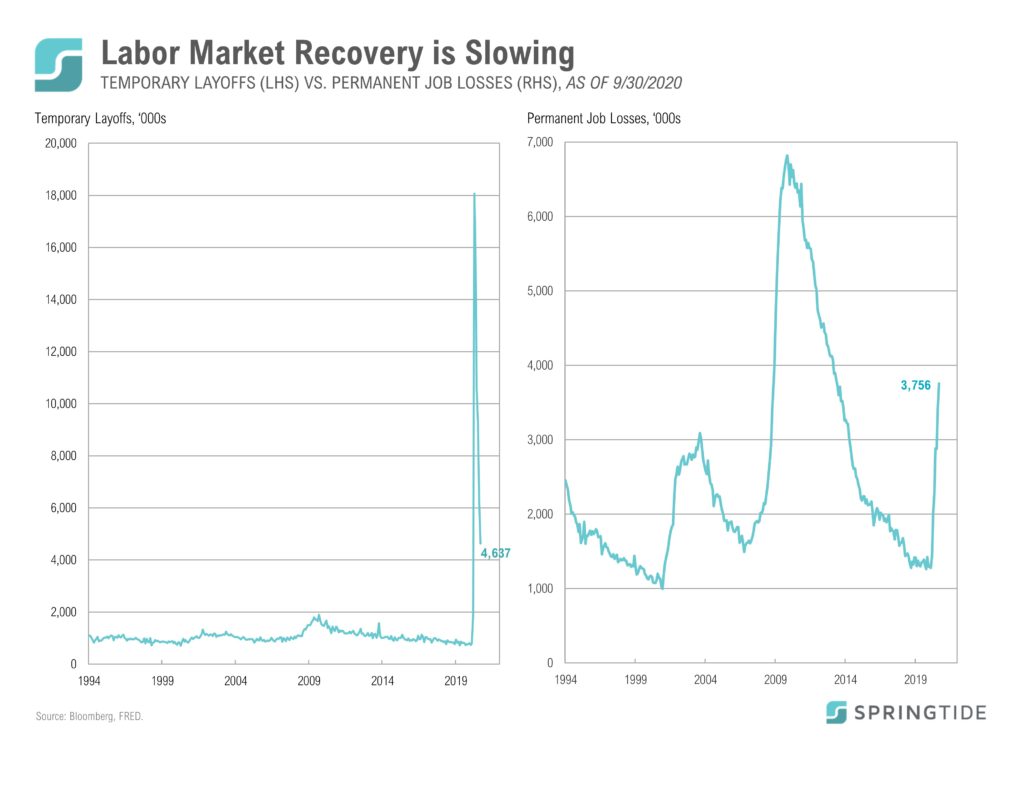
On Friday, the Bureau of Labor Statistics released the September jobs report…
3Q, 2020 Asset Class Return Quilts
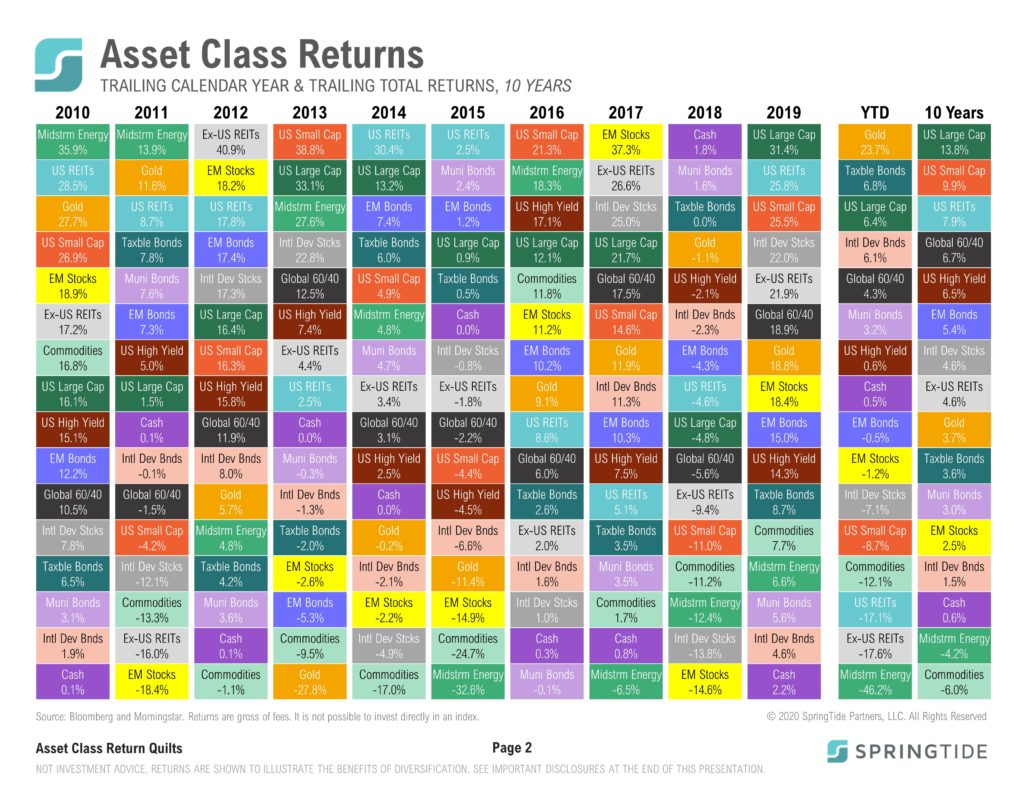
Gold and Taxable Bonds remained the best performing asset classes year to date. U.S. Large Cap Stocks continued to rally from the March 23 bear market lows, while U.S. Small Cap stocks lagged.
COTW: Inflation and the Stock Market
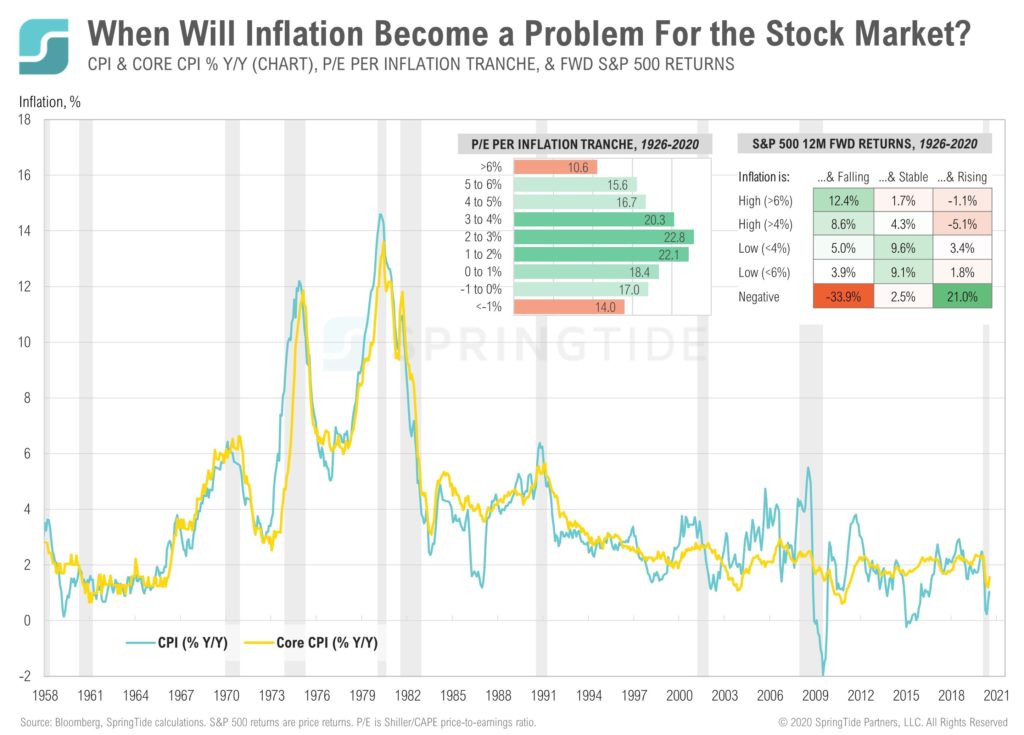
Recent guidance from the Fed suggesting they will tolerate higher inflation begs the question…
August 2020 Cartoon: Election Connection
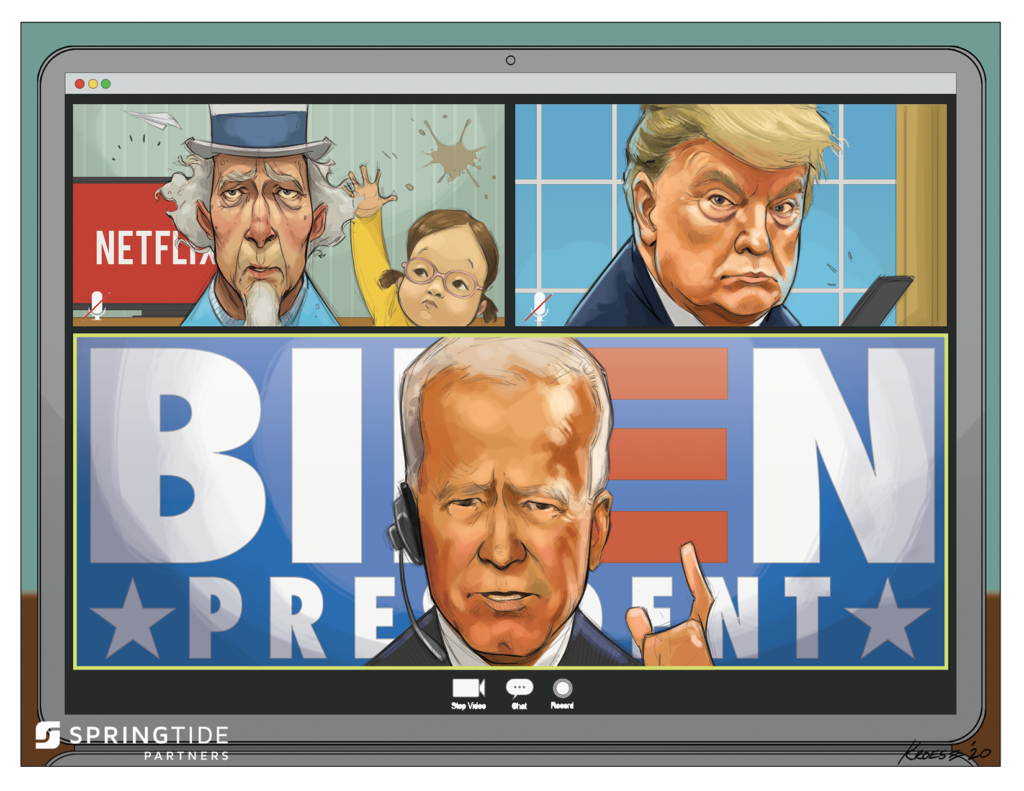
August 2020 Cartoon: Election Connection
COTW: Fed Policy and the Cost of Living
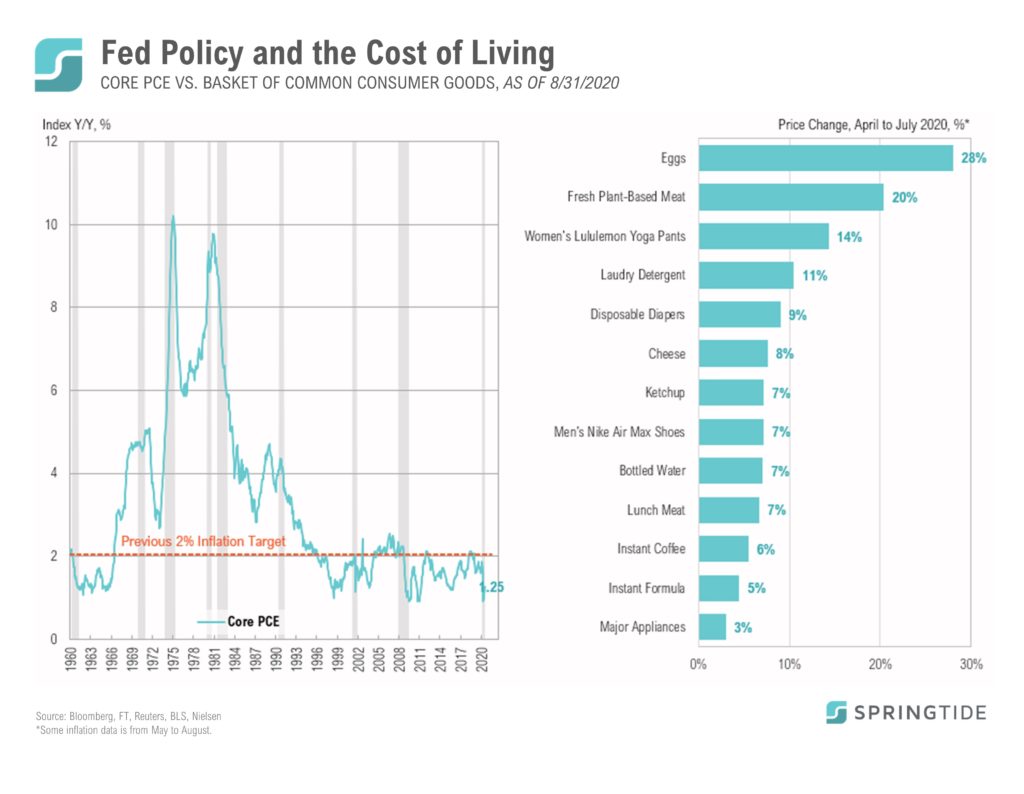
Last week’s Jackson Hole speech by Powell may have crystallized a regime change for Fed policy…
2Q, 2020 Asset Class Return Quilts
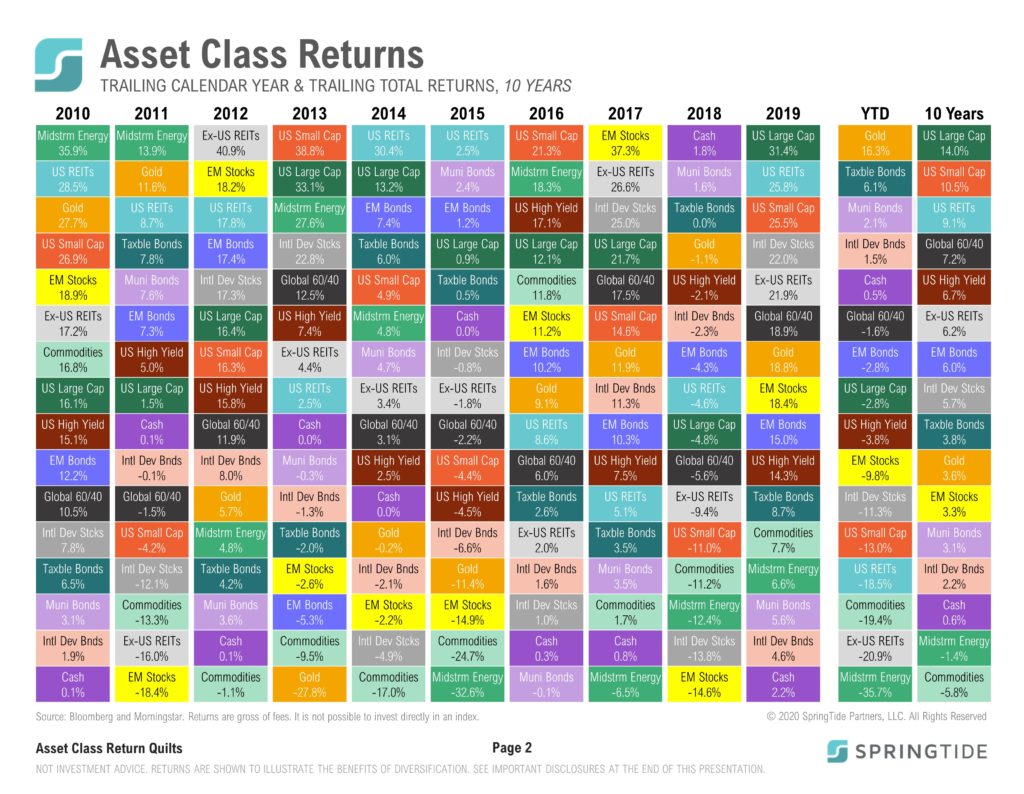
Gold and Taxable bonds remained on top, adding to their Q1 performance. U.S. Large Cap Stocks rallied 17.4% in Q2, narrowing the year-to-date loss to 2.8%.
June 2020 Cartoon: Heroes
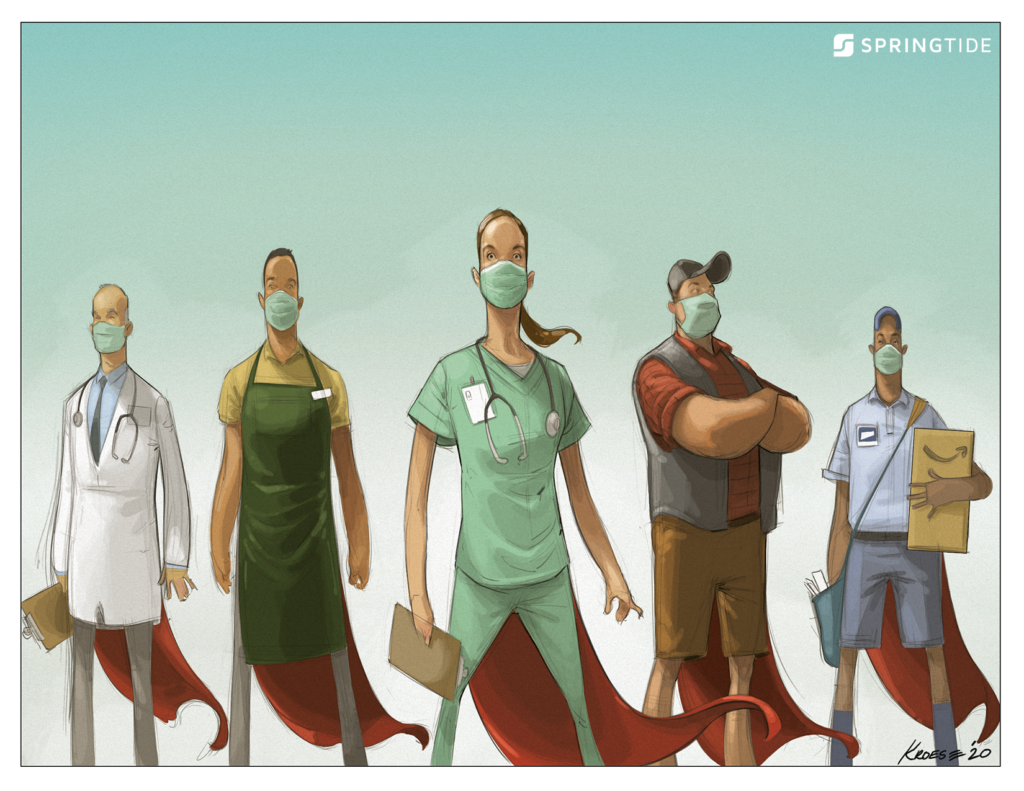
June 2020 Cartoon: Heroes
May 2020 Cartoon: The Reopening
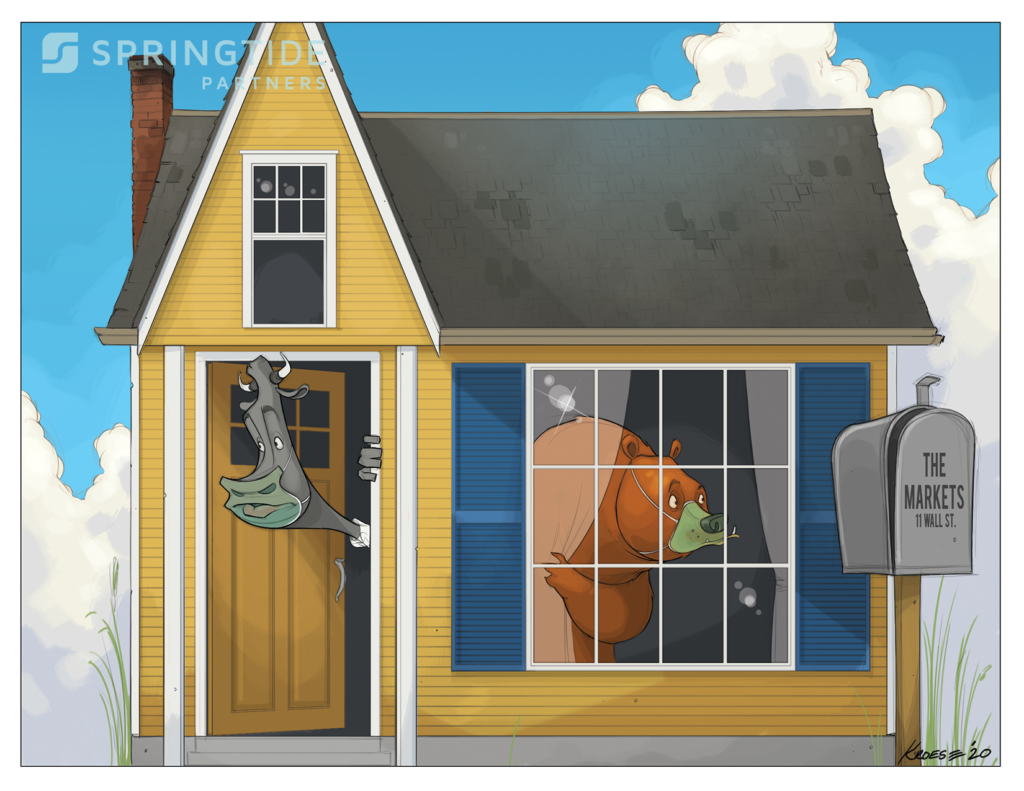
May 2020 Cartoon: The Reopening
COTW: U.S. Government Response to COVID-19 in Perspective
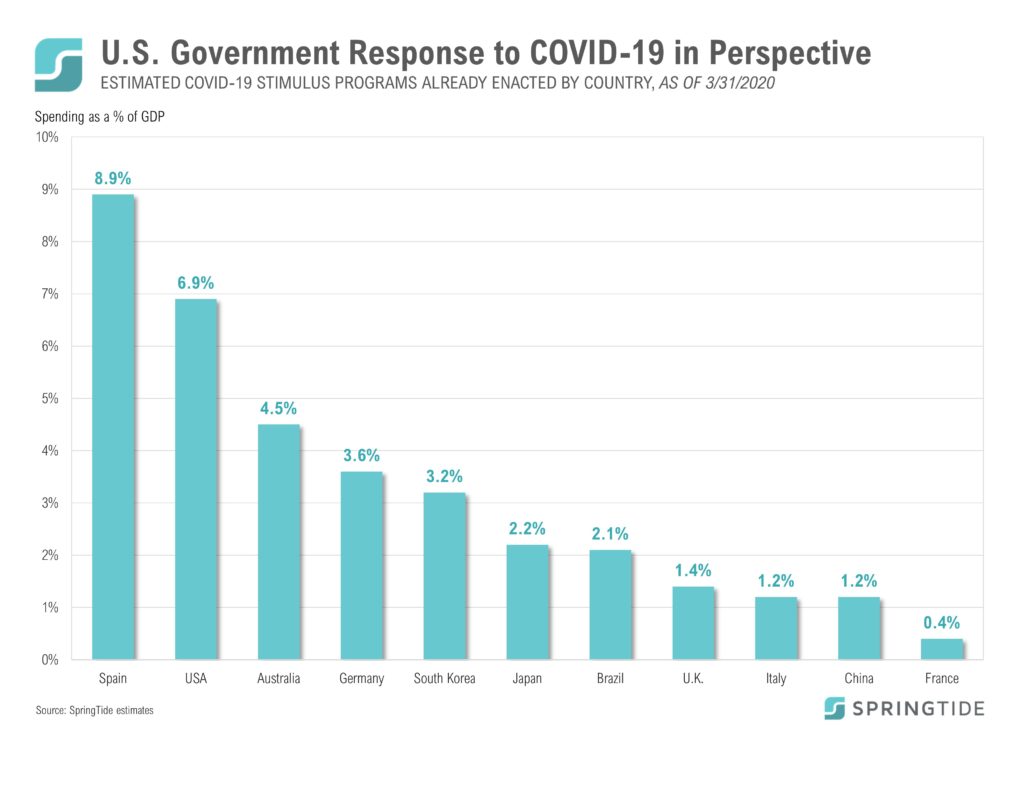
The coronavirus has pushed the global economy to the brink of a recession more severe than the 2008 financial crisis.
1Q, 2020 Asset Class Return Quilts
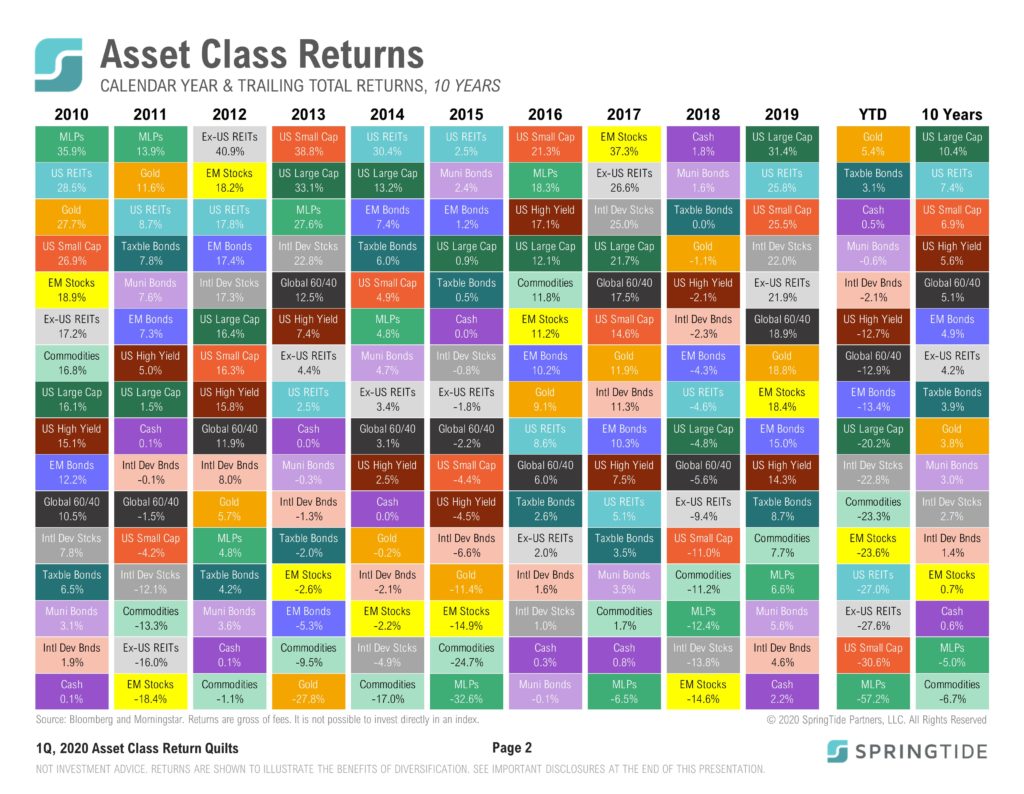
Gold, Taxable Bonds, and Cash finished the quarter on top and were the only asset class to post positive gains. U.S. Large Cap Stocks fell 20.2% in Q1, 2020.
March 2020 Cartoon: The Storm

March 2020 Cartoon: The Storm
COTW: The Fed’s Response to the Covid-19 Crisis
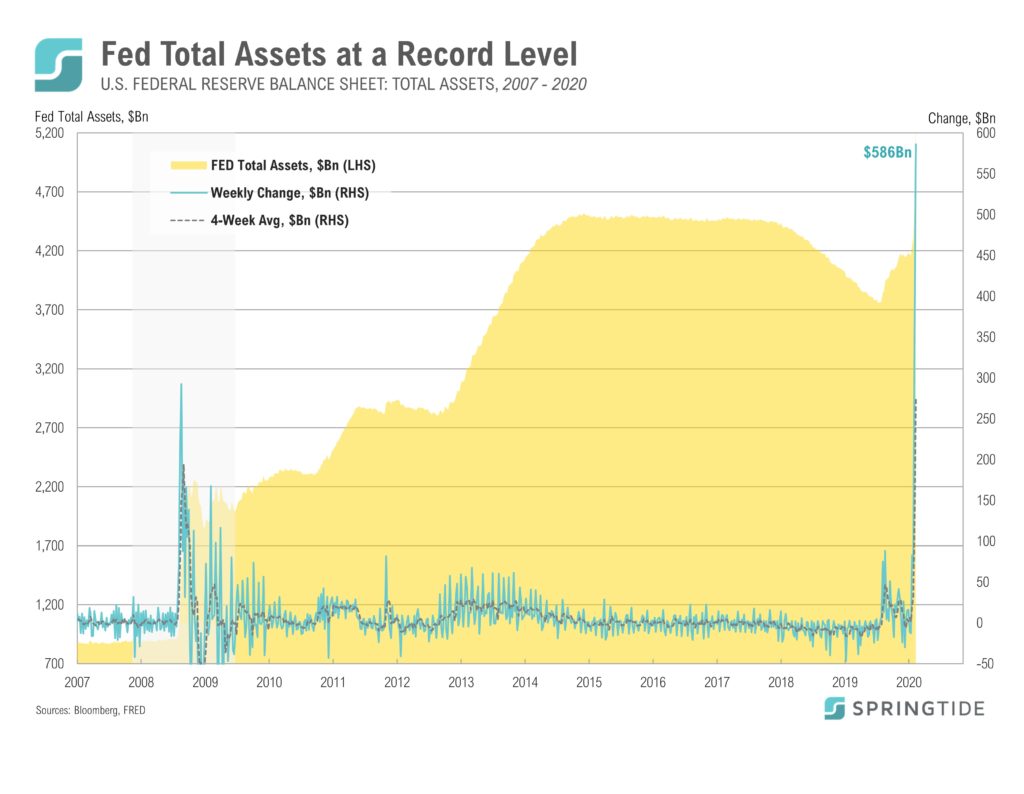
In response to the COVID 19 crisis, the U.S. Federal Reserve has restarted several emergency programs first implemented during the Global Financial Crisis.
COTW: Venture Capital Washout
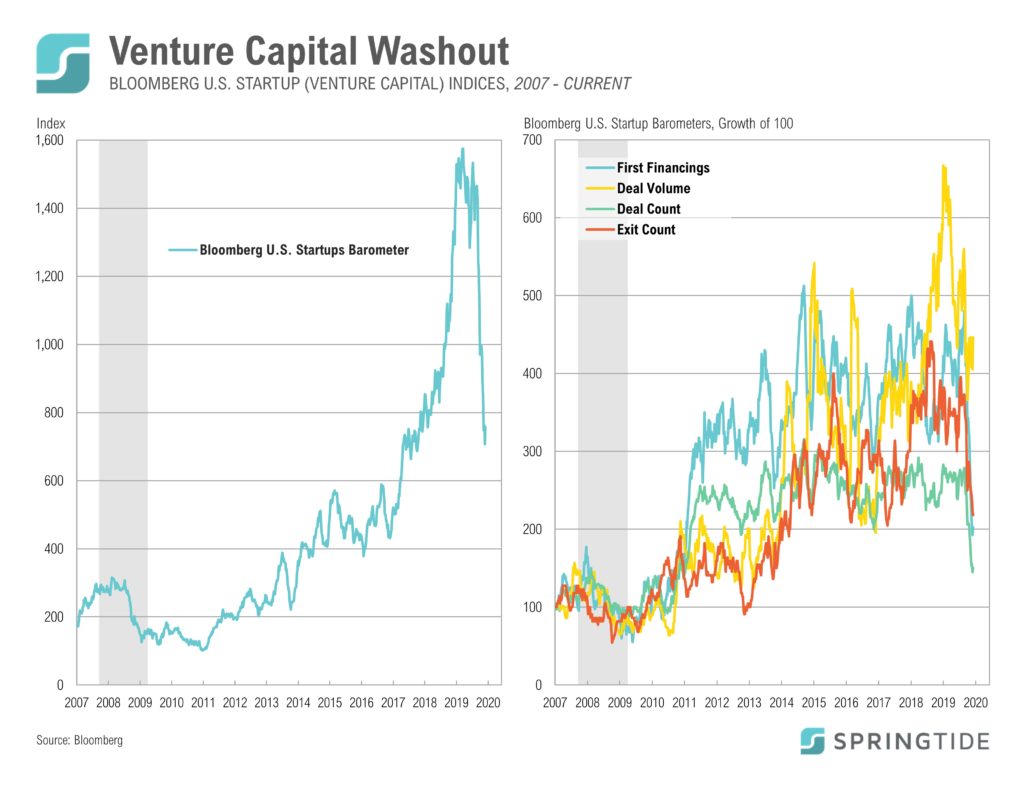
According to data from Bloomberg, Venture Capital activity is down 22% since the start of the year. However, that activity had already slowed dramatically prior to the COVID-19 crisis intensifying as the index reached an all time high in June of 2019 and is now d own 52%

