SUMMARY
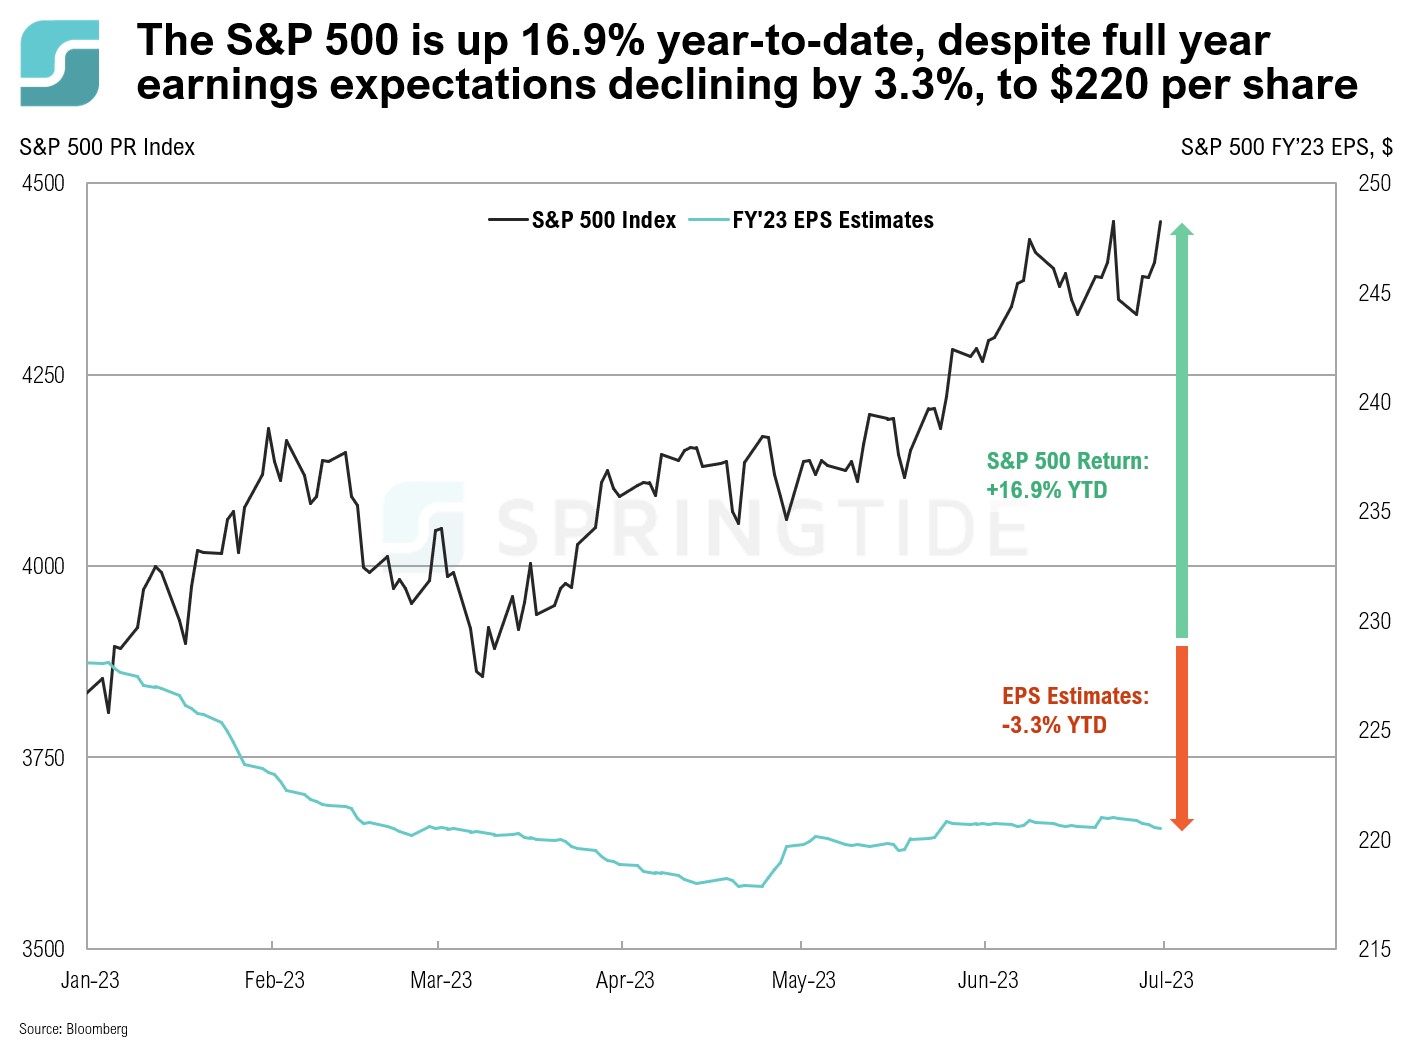
- The S&P 500 is up nearly 17% year-to-date and now up more than 20% since the October 2022 lows. However, with full year 2023 earnings per share estimates down 3.3%, there seems to be a disconnect.
- A key reason for this disconnect could be skewed P/E valuations. Currently, the 12-month forward P/E for the S&P 500 is 18.9x, which is above the 5-year average of 18.6x and well above the 10-year average of 17.4x. Another key reason could be the lack of market breadth, as only a handful of Big Tech companies have truly been driving S&P 500 returns higher.
- As we head into the second half of the year, and with Q2 earnings season set to start in the next few weeks, analysts are projecting full year 2023 earnings growth of only 0.9%, compared to the 4.2% earnings growth expected for 2023 in January.
DISCLOSURES
The material shown is for informational purposes only. Any opinions expressed are current only as of the time made and are subject to change without notice. This report may include estimates, projections or other forward-looking statements; however, forward-looking statements are subject to numerous assumptions, risks, and uncertainties, and actual results may differ materially from those anticipated in forward-looking statements. As a practical matter, no entity is able to accurately and consistently predict future market activities. Additionally, please be aware that past performance is not a guide to the future performance of any investment, and that the performance results and historical information provided displayed herein may have been adversely or favorably impacted by events and economic conditions that will not prevail in the future. Therefore, it should not be inferred that these results are indicative of the future performance of any strategy, index, fund, manager or group of managers. The graphs and tables making up this report have been based on unaudited, third-party data and performance information provided to us by one or more commercial databases. While we believe this information to be reliable, SpringTide Partners bears no responsibility whatsoever for any errors or omissions.
Index benchmarks contained in this report are provided so that performance can be compared with the performance of well-known and widely recognized indices. Index results assume the re-investment of all dividends and interest. The information provided is not intended to be, and should not be construed as, investment, legal or tax advice. Nothing contained herein should be construed as a recommendation or advice to purchase or sell any security, investment, or portfolio allocation. This presentation is not meant as a general guide to investing, or as a source of any specific investment recommendations, and makes no implied or express recommendations concerning the manner in which any client’s accounts should or would be handled, as appropriate investment decisions depend upon the client’s specific investment objectives.
SpringTide Partners, LLC is a registered investment adviser with the Securities and Exchange Commission; registration does not imply a certain level of skill or training. For more detail, including information about SpringTide’s business practices and conflicts identified, please refer to SpringTide Partners’ Form ADV Part 2a and Form CRS at: https://www.springtide-partners.com/disclosures


