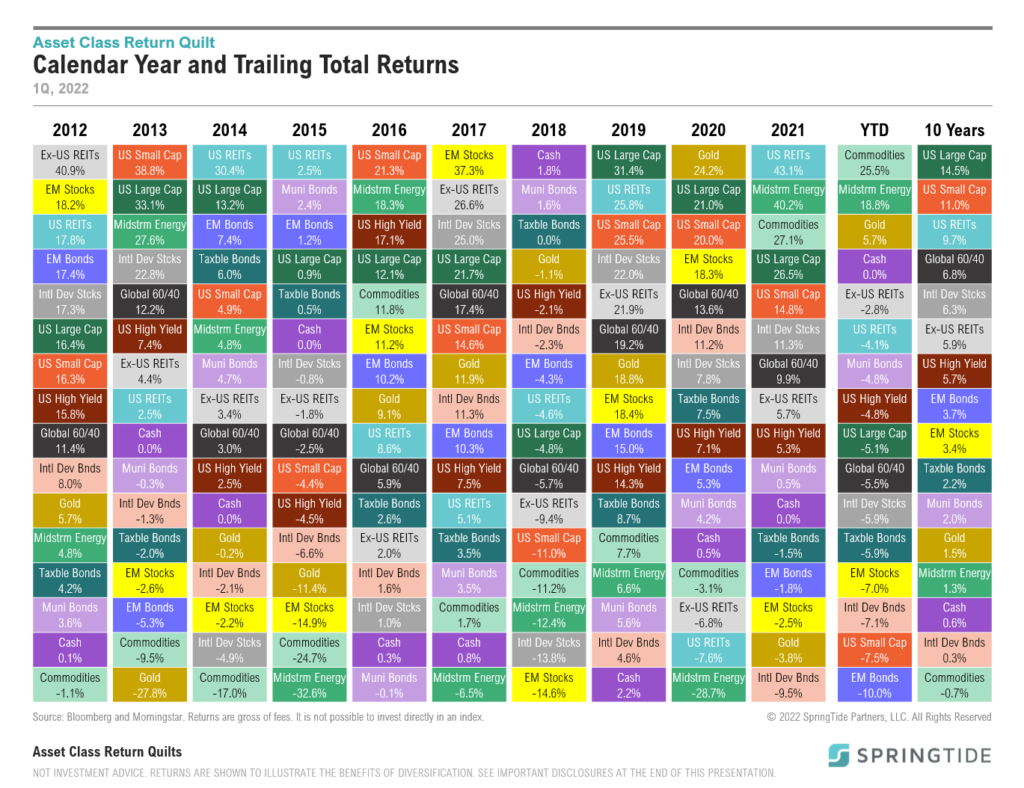
1Q, 2022 Asset Class Return Quilts
For the second time in two years, the global economy has been thrust into a crisis – first from the pandemic, and now from Russia’s invasion of Ukraine.
January 2022 Commentary: Behind the Curve
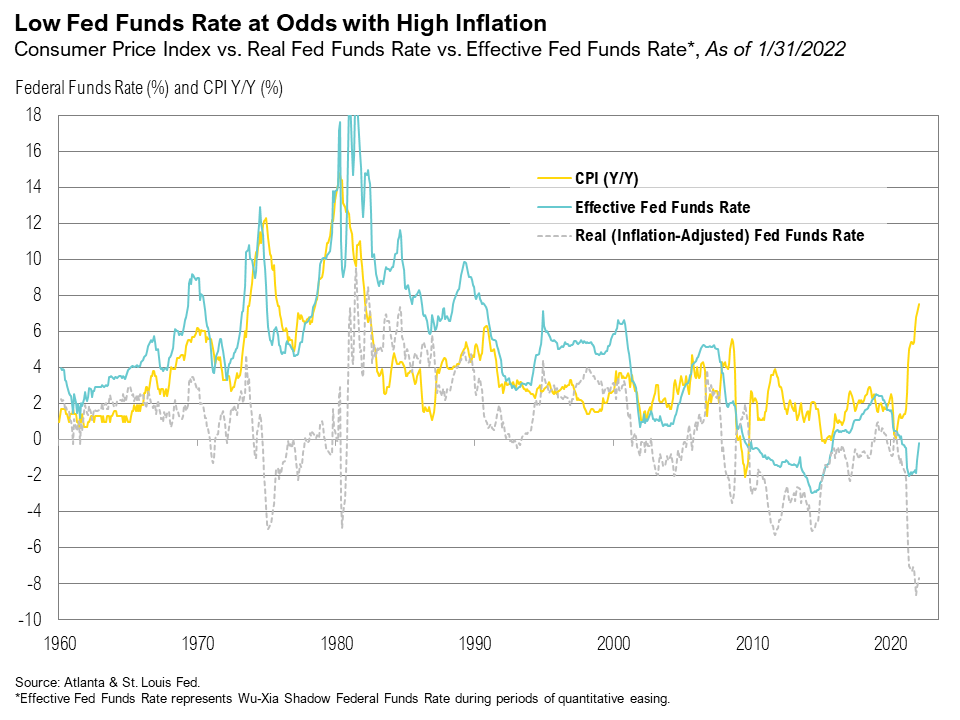
Volatility rose in January, and stocks dipped into correction territory as stubbornly high inflation raised the prospects for an accelerated Fed hiking cycle
Q4 2021 Commentary: Candyland
Equity markets delivered positive returns in the final quarter while fixed income returns were flat.
December 2021 Cartoon: Candyland
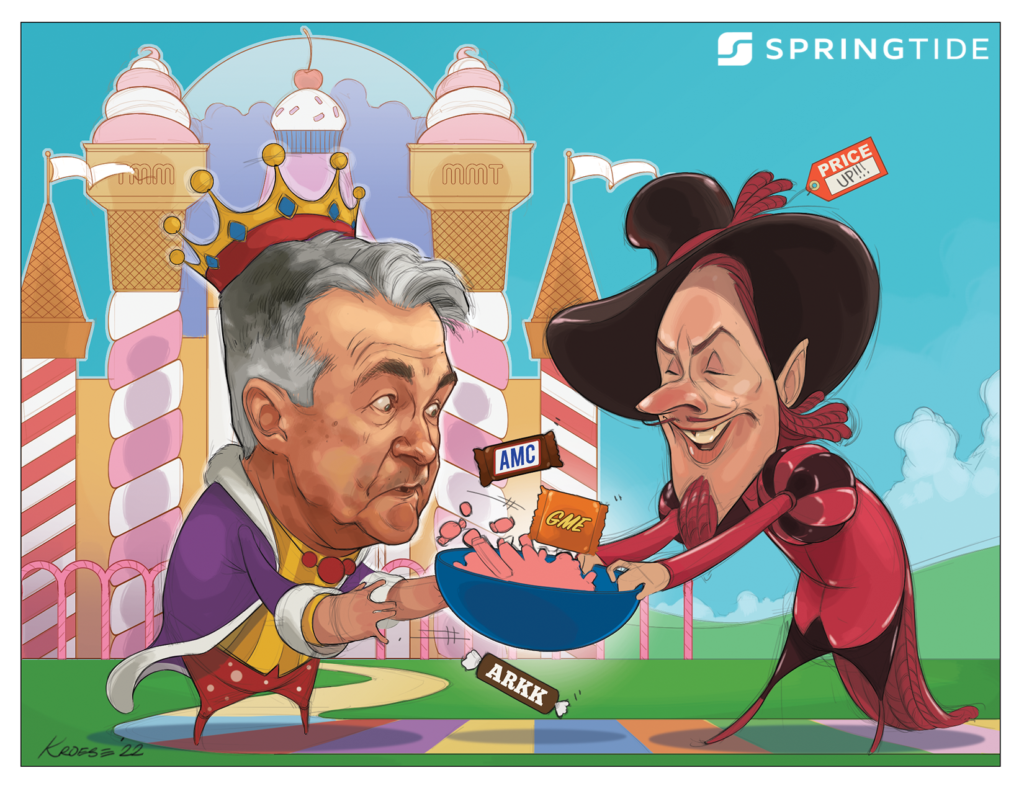
December 2021 Cartoon: Candyland
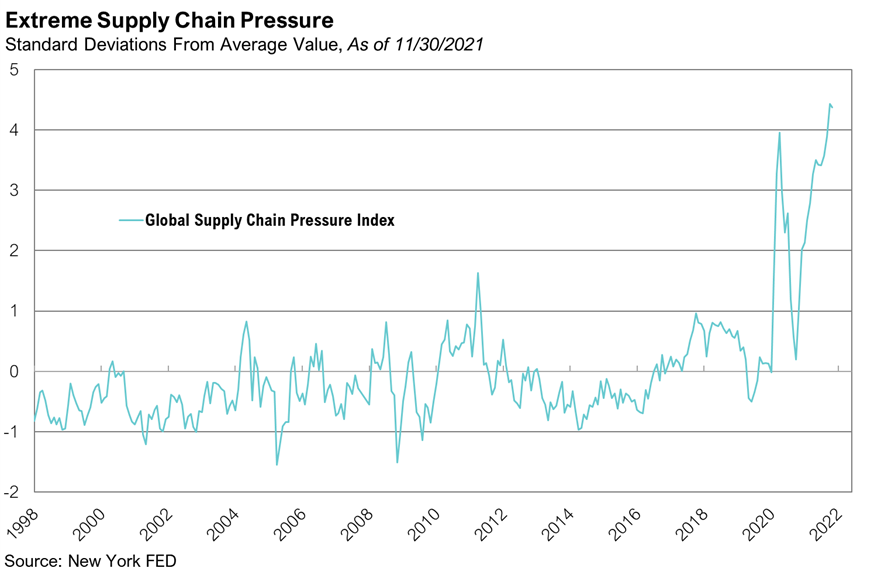
November 2021 Commentary: Coming to Grips with Persistent Inflation
Following its best month of the year, the S&P 500 Index cooled off in November, falling 0.7%.
November 2021 Cartoon: Santa Needs Help

November 2021 Cartoon: Santa Needs Help
October 2021 Commentary: Heating Up
The S&P 500 Index had its best month of the year in October, rising 7% and bouncing back from September’s 4.7% loss, its worst month since March 2020.
September 2021 Cartoon: Where are the Bond Vigilantes
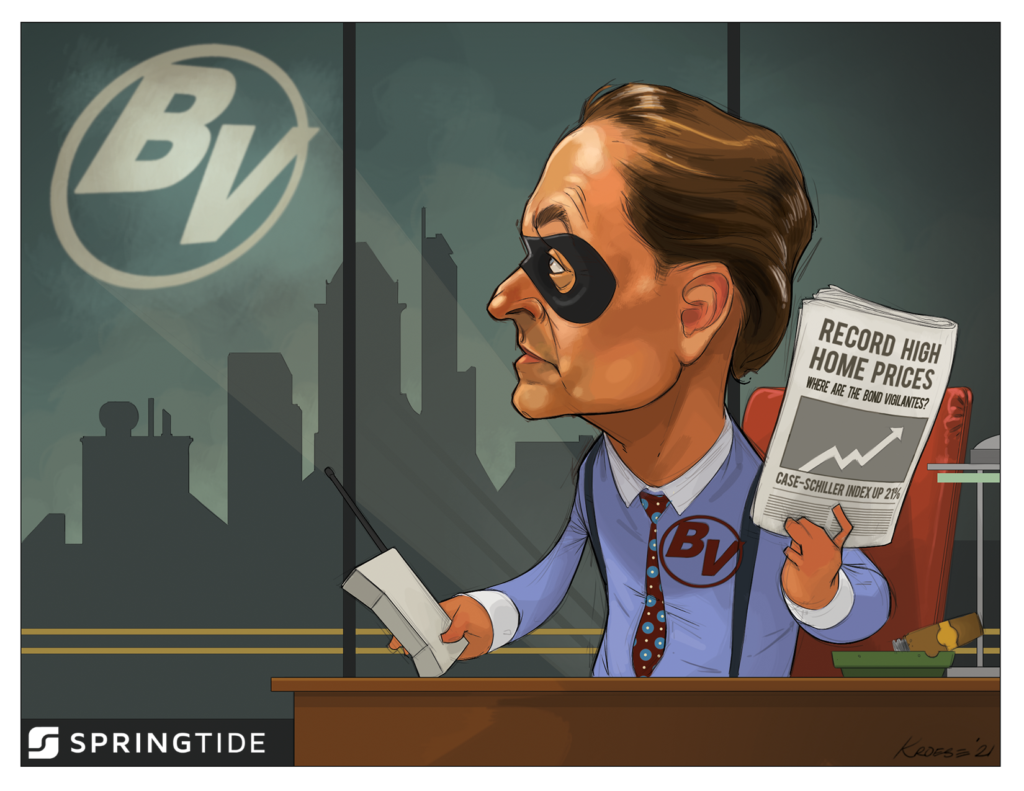
September 2021 Cartoon: Where are the Bond Vigilantes
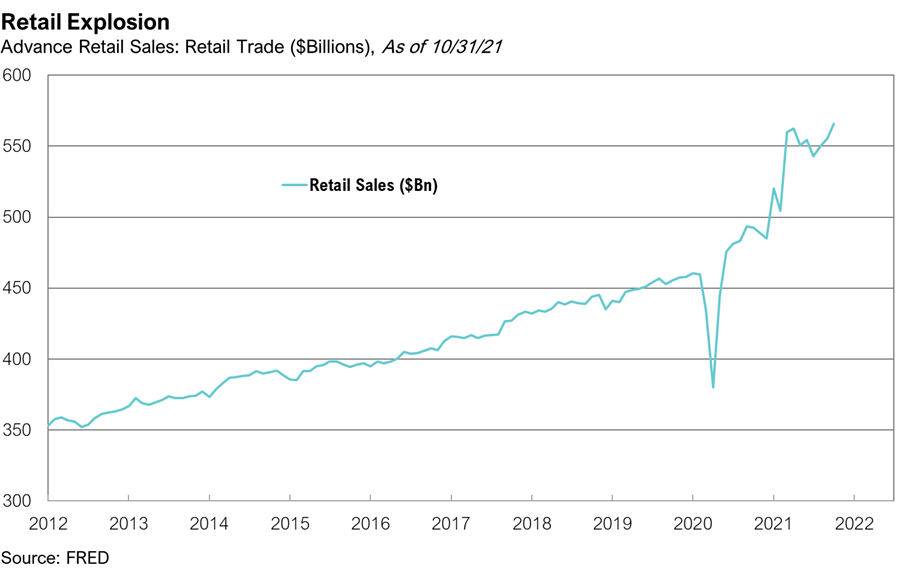
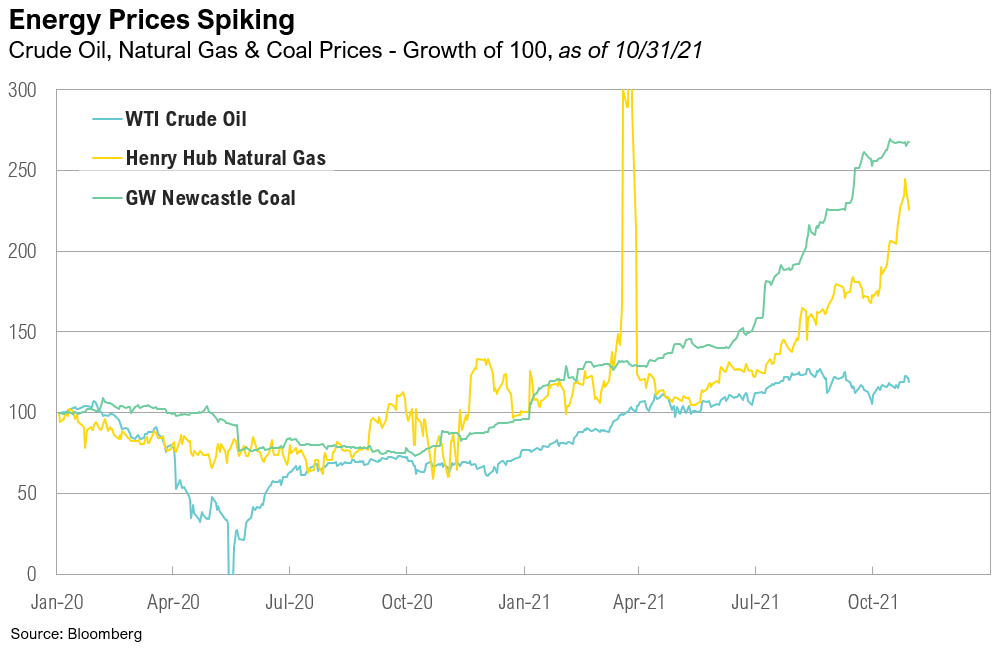
3Q 2021 Commentary: Bond Vigilantes
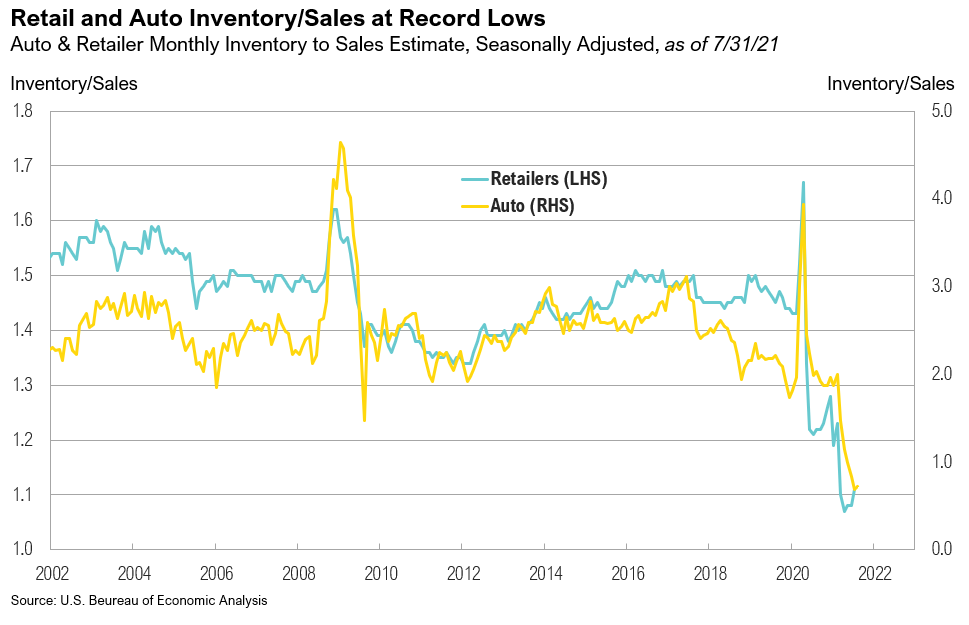
Markets delivered bland returns during the third quarter—a welcome development considering the stellar returns achieved earlier in the year.
August 2021 Commentary: Under the Surface
The U.S. stock market rallied for the seventh consecutive month in August, adding to an unusually impressive – and calm – year for risky assets.
July 2021 Commentary: Crypto, Corporate Earnings, and Covid
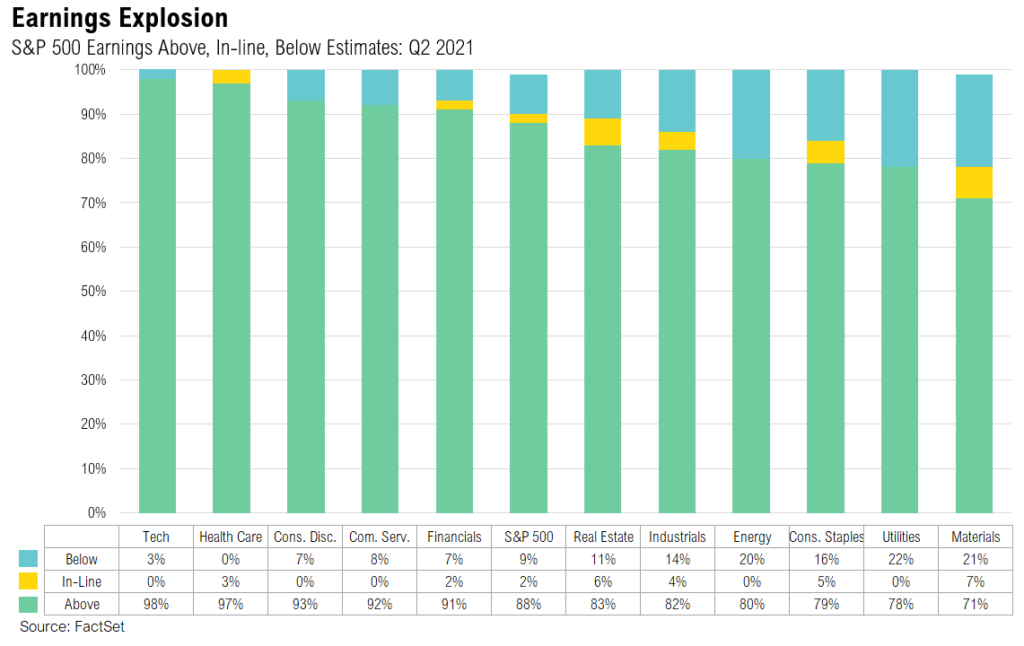
During July, fears of impending inflation declined, sparking a positive response in yield-sensitive assets and mixed results in other markets.
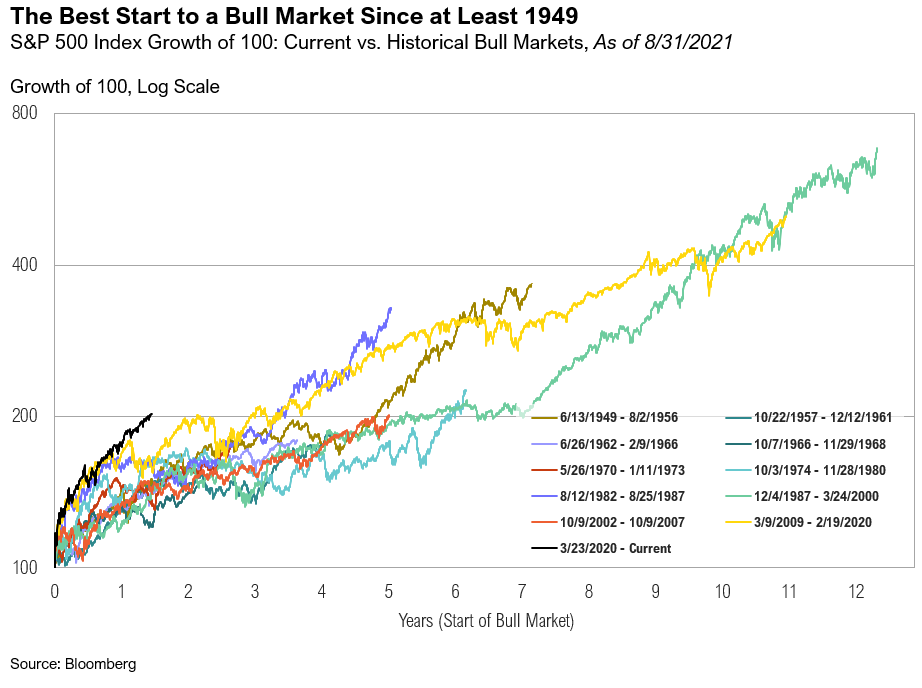
2Q 2021 Commentary: Taking Stock
Most asset prices rose during the quarter amidst continued economic reopening and extraordinary levels of policy accommodation.
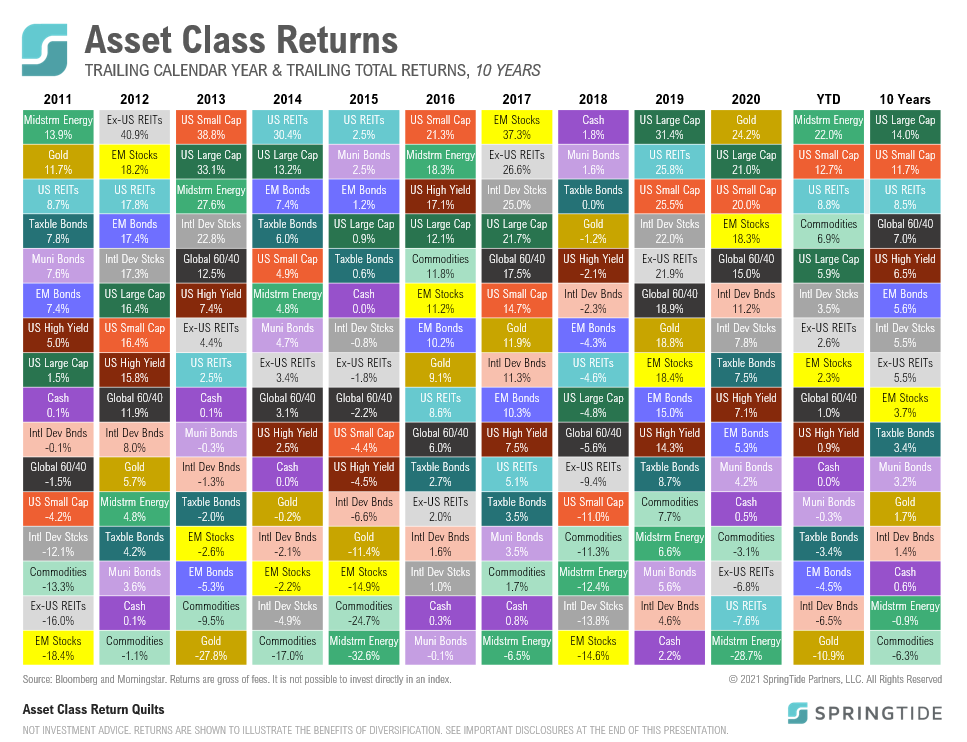
2Q, 2021 Asset Class Return Quilts
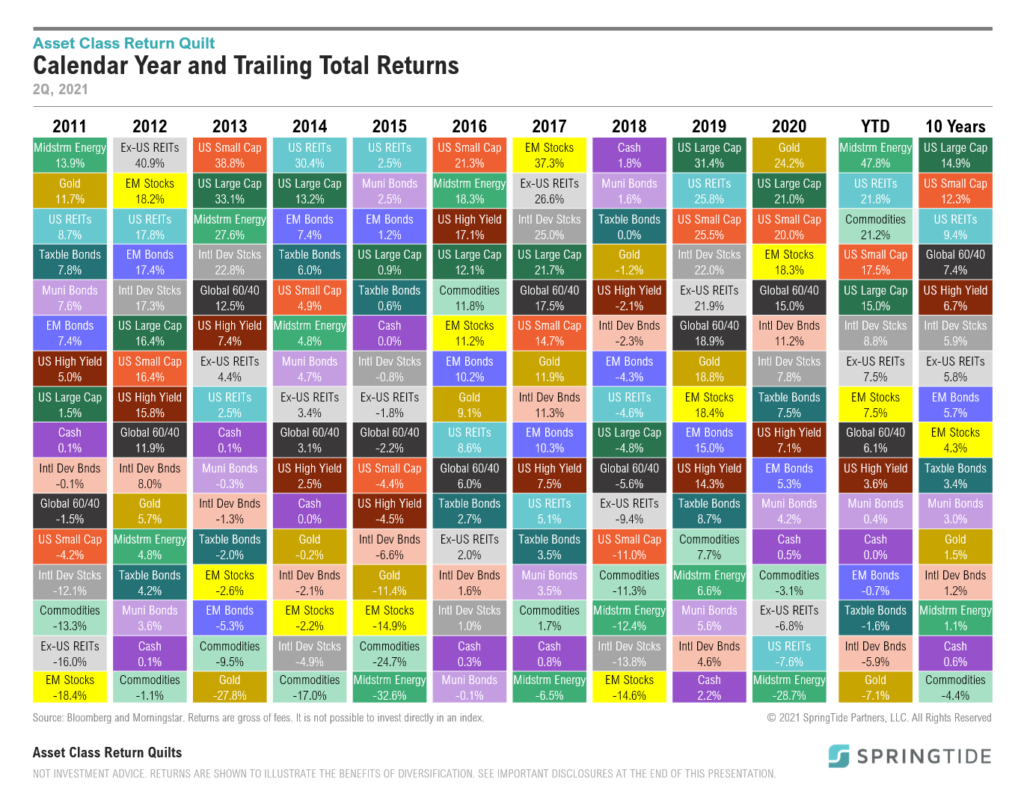
Midstream energy ended the year as the top-performing asset class, returning 30.9%.
June 2021 Cartoon: Inflation, Then vs. Now

June 2021 Cartoon: Inflation, Then vs. Now
Market Note: The Inflation Watershed
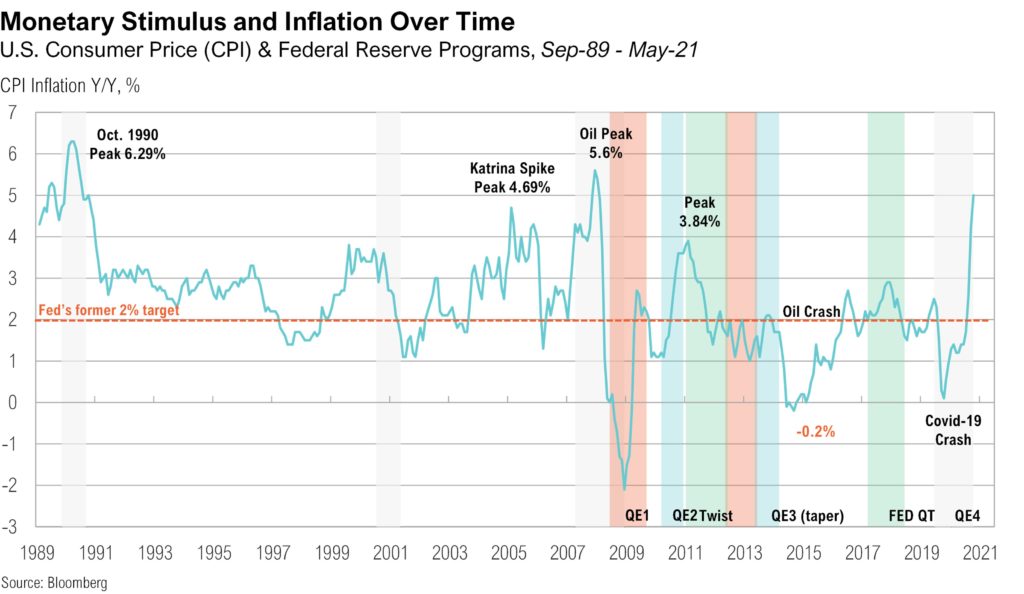
For over a decade, the Fed has struggled to hit its internal inflation target despite responding to every episode of economic weakness with increasingly extreme and experimental monetary policy, including 0% interest rates and widescale asset purchases.
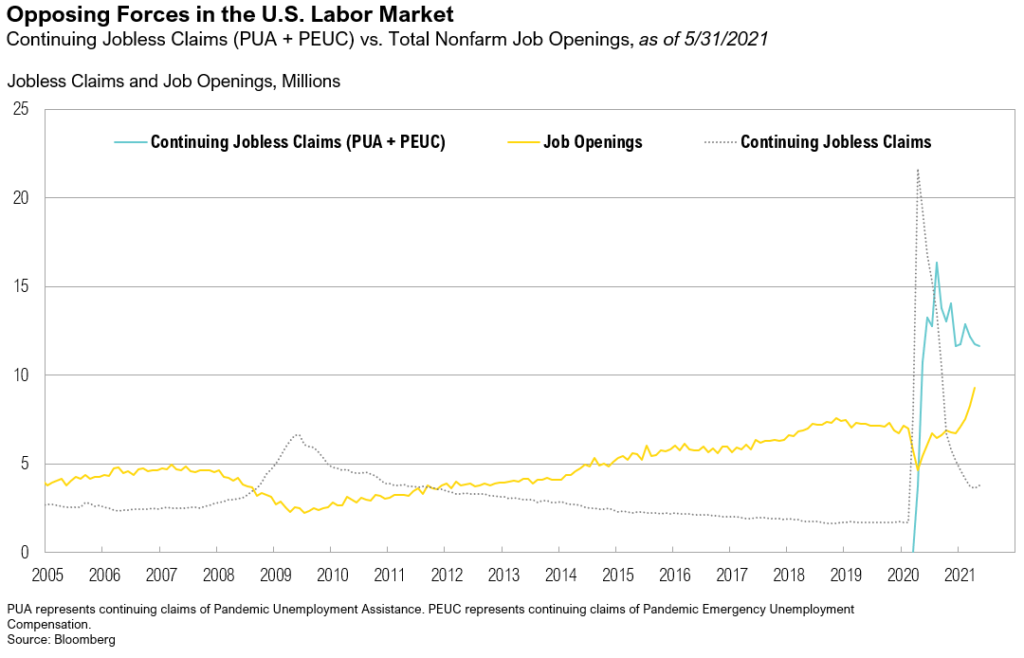
May 2021 Commentary: Help Wanted
Real assets were the top performers for the month of May due to the continued reopening of the U.S. economy and historic levels of stimulus from Washington
April 2021 Commentary: Happy Anniversary, Inflation!
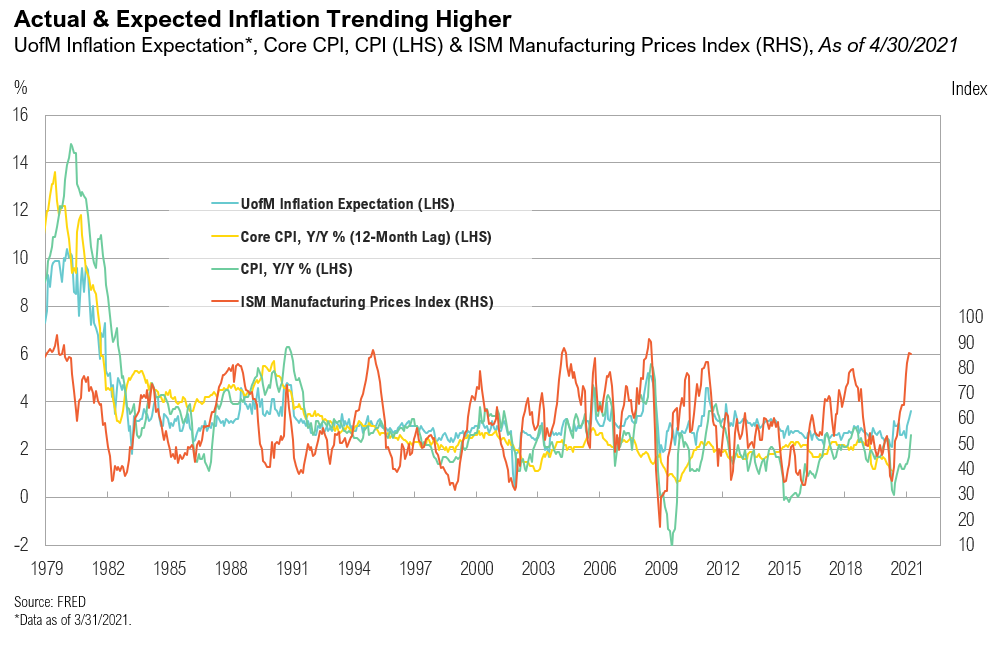
All asset classes rose for the month, and most have generated year-to-date returns that would be considered attractive for an entire year.
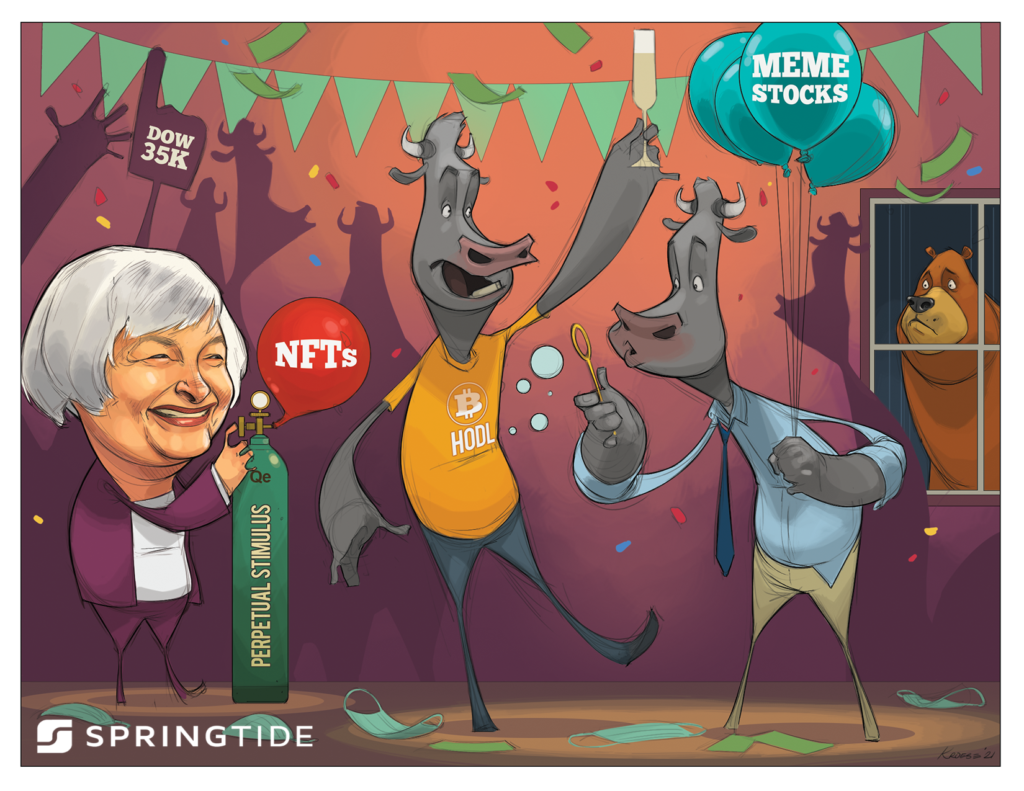
1Q 2021 Commentary: Throw the Confetti
At the end of the quarter, investors enjoyed the robust returns of riskier asset classes and policymakers’ continued commitment to extraordinary accommodation.
1Q, 2021 Asset Class Return Quilts
Midstream energy ended the year as the top-performing asset class, returning 30.9%.
March 2021 Cartoon: Throw the Confetti
March 2021 Cartoon: Throw the Confetti
December 2020 Cartoon: Try Not to Suck, 2021
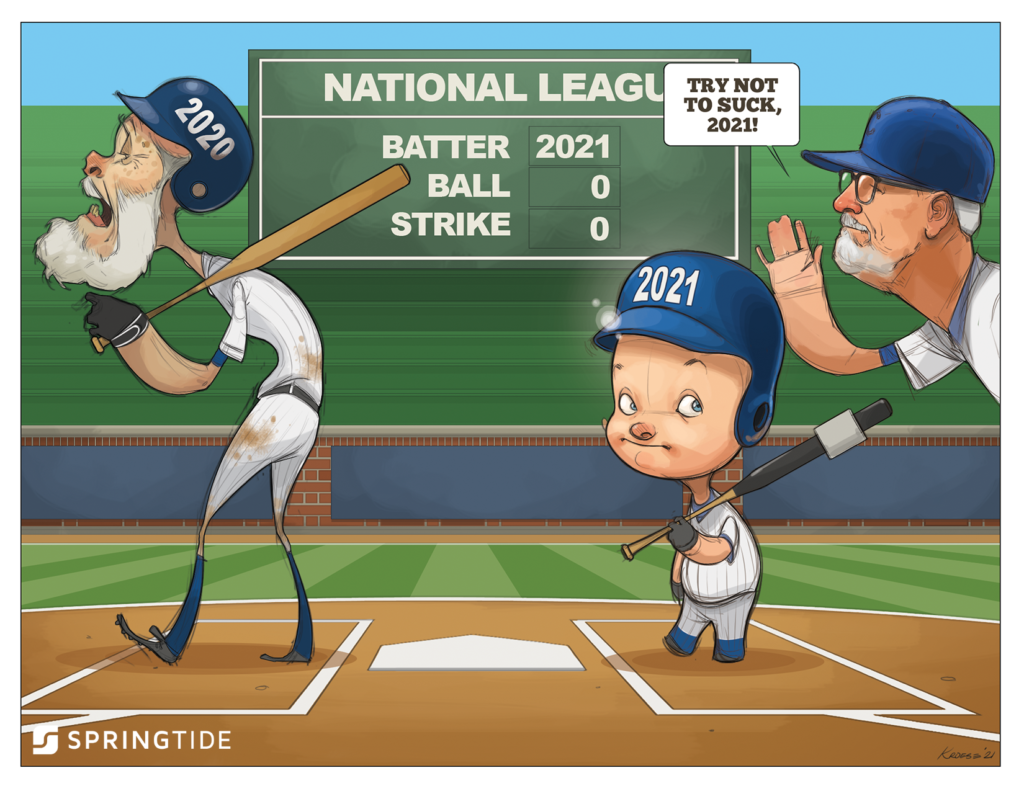
December 2020 Cartoon: Try Not to Suck, 2021
Market Note: What Happened to Bitcoin?
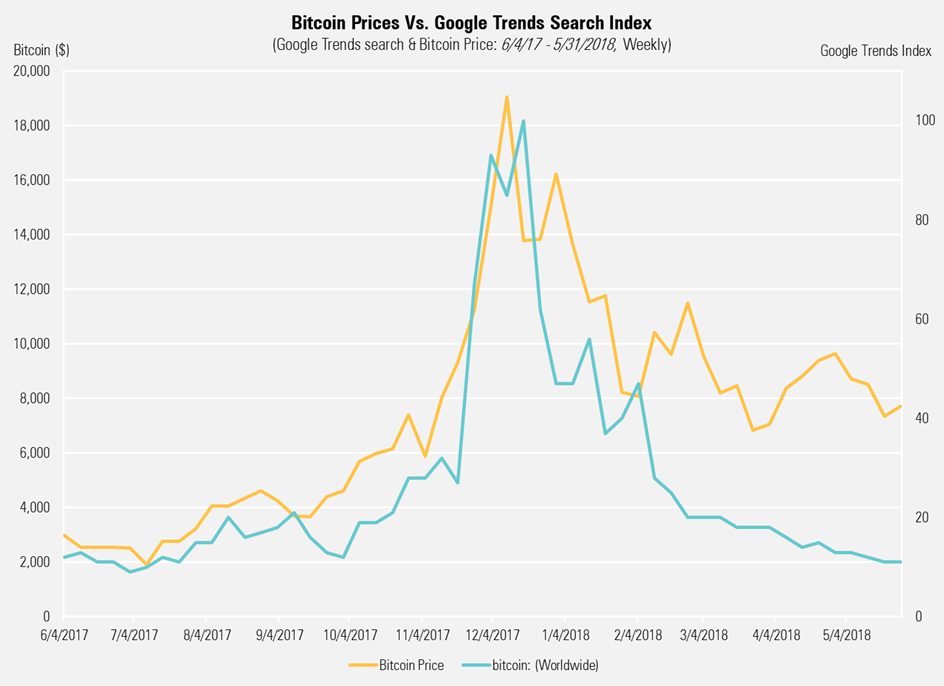
Bitcoin and other digital assets remain polarizing among investors, garnering many diverse viewpoints of what the technology can or cannot become.
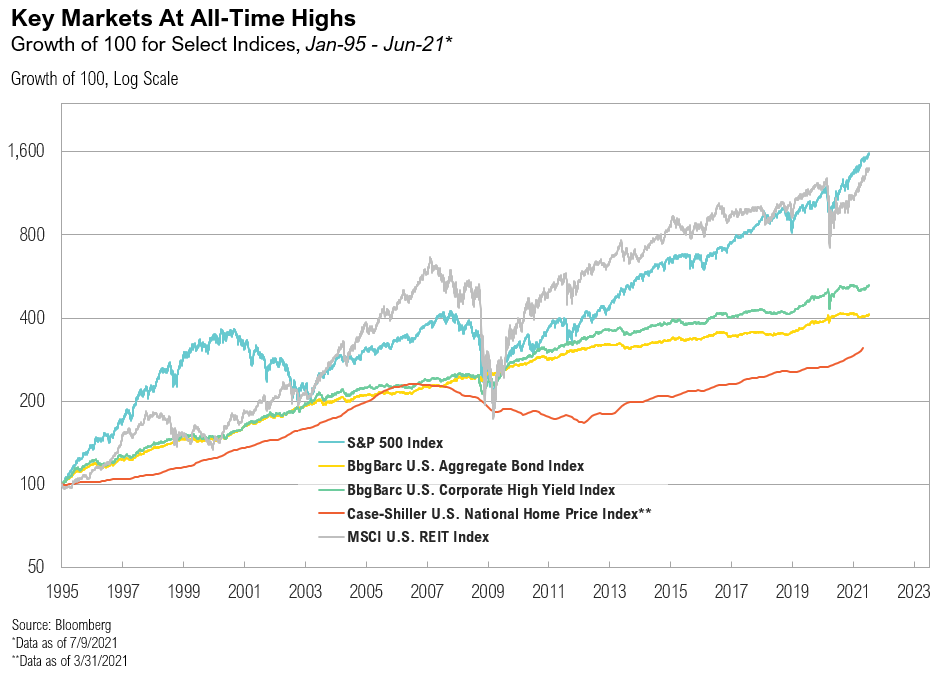
Market Note: Bubbles, Bonds, and Diversification
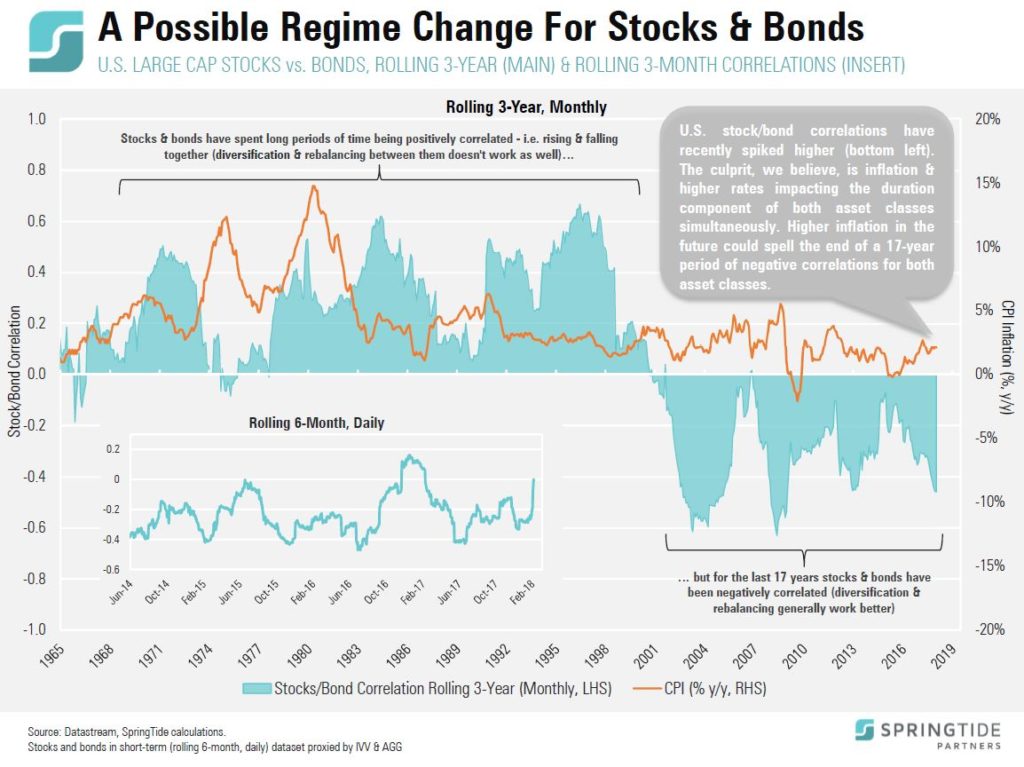
On February 5th, two bubbles burst. The first was the tulip bubble, and the second was the bubble in complacency (low volatility).
Market Note: 396 Days and Counting
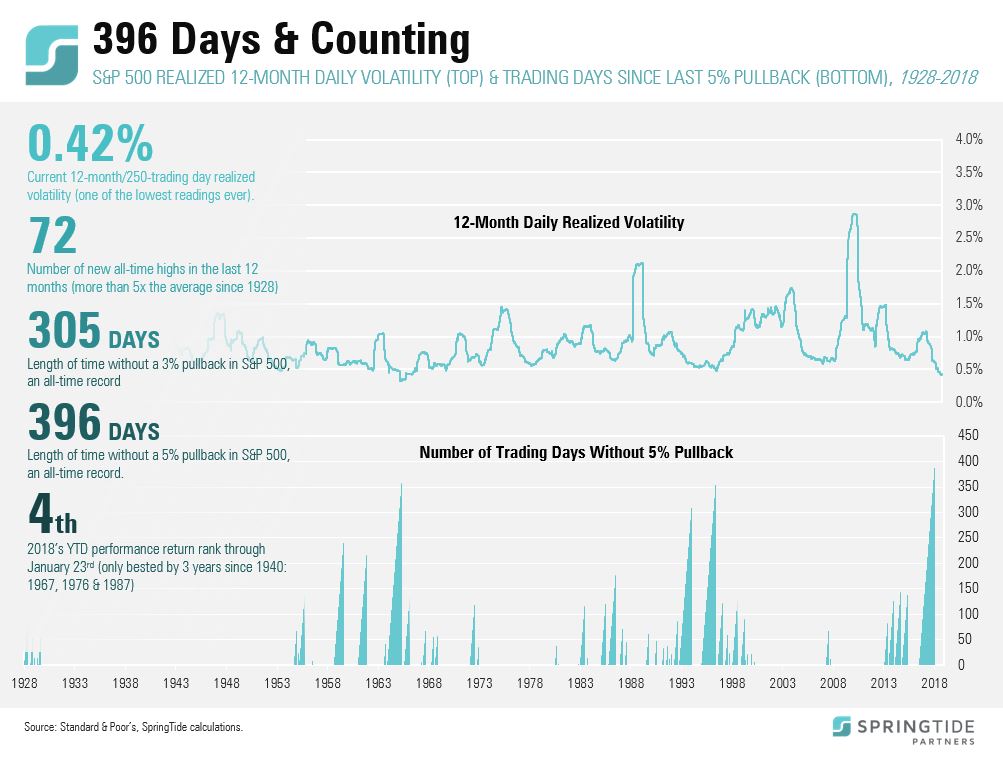
The last time we had a drawdown in the S&P 500 of 3% or more was 305 trading days ago.